I love the cadence of this chart
Bitcoin % of Supply in Profit/Loss
As I said previously, you start looking for major market cycle bottoms *after* they cross, not before.
They just crossed.
Such a great chart for keeping people on the right side of the market in midterm years
HISTORY IS ABOUT TO REPEAT
In 1929, a statistician named Roger Babson stood in front of Wall Street and warned them the crash was coming.
They laughed
Bankers, traders, financial press - all of them.
49 days later, the crash hit.
The same Wall Street that had laughed at him was suddenly broke.
Babson wasn't lucky.
He had identified a 5-stage pattern that appears before every major financial collapse
Same 5 signals. Same sequence. Different decade.
The pattern showed up before:
1929
1987
2000
2008
Every time, the people who ignored it lost everything.
2026 isn't different.
4 out of those 5 stages have already triggered.
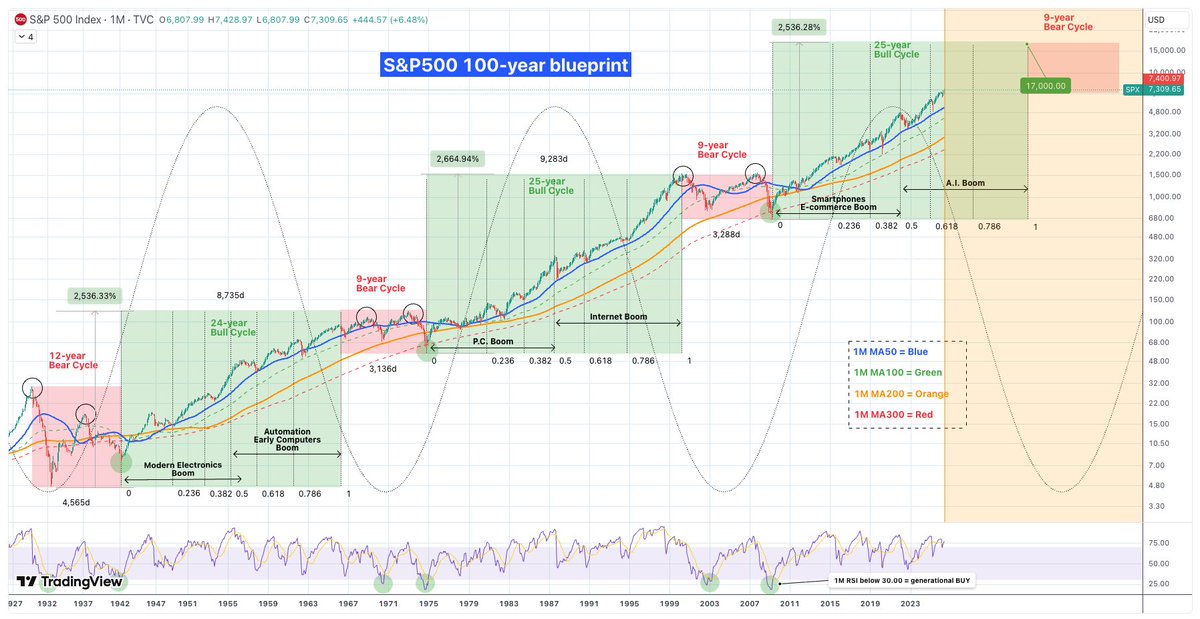
Der 100-Jahre-Plan für den Aktienmarkt
Wenn du dir die letzten 100 Jahre anschaust, siehst du ein klares Muster: Der Markt wiederholt immer wieder die gleichen Zyklen. Seit der Großen Depression 1930 gab es drei große Abwärtsphasen und drei Aufwärtsphasen .
Wir stecken gerade mitten im dritten großen Bullenmarkt.
Die schlechten Zeiten (Bärenmärkte)
Diese Phasen dauerten meistens etwa 9 Jahre (die Weltwirtschaftskrise von 1930 war mit 12 Jahren eine Ausnahme). Ein typisches Zeichen war, dass der Markt zweimal oben und zweimal unten „anklopfte“, bevor es wieder aufwärts ging. Oft krachte der Kurs bis zu einer bestimmten langfristigen Linie (dem 300er-Schnitt im Monatschart) und startete von dort aus neu durch.
Die guten Zeiten (Bullenmärkte)
Die ersten beiden großen Aufwärtsphasen dauerten jeweils 24 und 25 Jahre. Das Spannende: Sobald der Markt einmal Fahrt aufgenommen hatte, fiel er fast nie unter eine bestimmte grüne Linie (den 100er-Schnitt). Die blaue Linie (50er-Schnitt) war dabei immer die beste Chance, um günstig nachzukaufen, wenn es mal zwischendurch ruckelte.
Warum steigt der Markt so extrem?
Hinter jedem Bullenmarkt steckt eine neue Technologie:
Früher waren es industrielle Durchbrüche.
Dann kam der Internet-Boom.
Heute erleben wir den E-Commerce- und Social-Media-Boom.
Klar, irgendwann platzen diese Blasen immer, weil die Leute übertreiben. Aber die Technik bleibt! Das Internet ist nicht verschwunden, nur weil die Kurse im Jahr 2000 abgestürzt sind – es wurde zum Fundament für alles, was wir heute nutzen.
Der KI-Boom
Wir sind jetzt im zweiten Teil des aktuellen Aufschwungs, und der wird von der Künstlichen Intelligenz getrieben. Wahrscheinlich wird diese Blase um das Jahr 2034 platzen. Das wird wehtun, aber danach wird KI das feste Rückgrat unserer gesamten Wirtschaft sein.
Im Grunde sind die letzten 100 Jahre eine Kette von Erfindungen, die die Kurse immer höher treiben. Die Abstürze zwischendurch sind nur dazu da, die heiße Luft rauszulassen und Platz für neues Geld und die nächste Technologie zu machen.
Was bedeutet das für dich heute?
Wenn dieser Zyklus so läuft wie die letzten beiden, könnte der S&P 500 bis auf 17.000 Punkte steigen.
Es wird zwischendurch immer wieder Korrekturen geben. Der Zoll-Crash Anfang 2025 war so ein Moment, hat aber die wichtige blaue Linie nicht ganz berührt.
Schau auf den RSI-Anzeiger. Wenn der unter 30 fällt, ist das eine Chance des Jahrzehnts. Das ist in 100 Jahren erst sechsmal passiert – und jedes Mal war es der perfekte Zeitpunkt zum Kaufen.
Liken, Folgen, Speichern, Kommentieren, Teilen.
Danke für den Support 🫶😊🫶
🚨 JUST IN: Anthropic's own team just showed how to actually prompt Claude.
24 minutes. FREE for you. From the people who built it.
Watch it. bookmark it.
Your arteries may need more than just medication.
Low nitric oxide and inflammation can damage blood vessels and lead to plaque buildup.
Use this simple daily drink to help support better blood flow and artery health.
https://t.co/ALrbh7TSKk
Some fruits contain compounds so protective that researchers study them for their ability to slow or block cancer growth.
These nutrients support your gut, shield your DNA, and help your cells undergo autophagy before damaged proteins become a problem.
Learn which fruits offer the strongest anticancer support and how to incorporate them into your diet daily.
https://t.co/rx0METRe84
Left: Webber, Suzuka, 2013
Right: Verstappen, Suzuka, 2026
Same straight, find the differences
Watch where the speed starts to disappear because the battery is empty and the superclipping starts
They killed the element of @F1 that made it attractive: full throttle, last one who blinks, attacking corners on the limits of what these cars could handle
Excellence in driving was rewarded
Now excellence in battery technology is rewarded and great drivers no longer make the difference. Also why Russel isn’t miles ahead of Kimi, why Hamilton is on par with Charles and Hadjar is the closest teammate to Verstappen since Ricciardo.
The ICE is now just a glorified generator, energy is taken away from the straight into cornering speed and stored in the battery to increase acceleration out of corners, which, like Alonso said, the kitchen chefs could drive just as easily.
It has been a week since the Diego Garcia attack. No one is talking about it anymore. A very obvious false flag.
Then the antisemitic attack on ambulances. Next day 2 guys were arrested, terrorist attack got downgraded to "arson", no names released. Another false flag.
If everyone jumps on something and it's all over your feed with outrage. It has been pushed by Israeli handlers and is an obvious false flag.
Iranian girls school, "Iranian missile did it". But when it was clear it was a US double tap, all the accounts ignored it.
Just like the media and big accounts have been ignoring Gaza and the recent torture of 1 year old kid.
What kind of a fucked up world is this when the pedophiles and genocidal maniacs don't get called out and arrested. People just ignoring all of it.
Insanity
Low stomach acid may be behind your bloating and acid reflux.
Symptoms like gas, indigestion, and nutrient issues can come from not having enough acid to break down food.
Try these simple tests to check if your stomach acid is too low.
https://t.co/G3AvlVBW2g
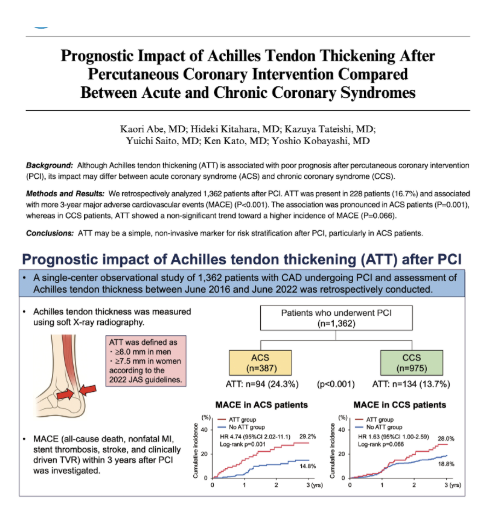
Your ankle is a window into your heart.
A new study found that patients with a thickened Achilles tendon were nearly twice as likely to experience a major cardiovascular event within three years of a coronary stent procedure.
An observational study retrospectively compared outcomes for 1362 participants with coronary artery disease undergoing PCI, examining differences between patients with and without Achilles tendon thickening (defined as ≥8 mm in men or ≥7.5 mm in women).
Patients with thickened Achilles tendons faced a 99% higher risk of major adverse cardiovascular events (MACE) over three years (28.4% vs 17.9% for those with and without thickening, respectively).
(MACE was defined as all-cause death, nonfatal myocardial infarction, stent thrombosis, stroke, and clinically driven target-vessel revascularization.)
Thickened Achilles tendons were more prevalent in patients with the more severe, rapidly developing, and less stable acute coronary syndrome (ACS) (24.3% had thickened tendons) compared to patients with the more stable chronic coronary syndrome (CCS) (13.7% had thickened tendons).
Among ACS patients, having a thickened Achilles tendon was a significant predictor, increasing the risk of a recurring major cardiovascular event within the next three years by 4.7 times.
The findings suggest that Achilles tendon thickening may serve as a prognostic marker in patients with cardiovascular disease, with special value in predicting early recurrence of major adverse cardiovascular events in patients with acute coronary syndrome.
While the analysis did not include blood cholesterol levels and does not establish causation, one plausible explanation is that Achilles tendon thickening reflects cumulative exposure to elevated LDL cholesterol over many years. This may be especially relevant in familial hypercholesterolemia, a genetic disorder characterized by markedly elevated LDL cholesterol, in which Achilles tendon thickening is also used as a diagnostic criterion.