Struggling with messy legends in your plots? The legendry package for ggplot2 helps you create cleaner and more effective visualizations in R. With better control over legends, it makes your plots easier to understand.
Here’s why legendry is a game-changer:
✔️ Customizable Legends: Fine-tune legend positions, titles, and layouts effortlessly.
✔️ Enhanced Readability: Improve plot clarity by adjusting legend elements to fit your audience’s needs.
✔️ Consistency Across Plots: Maintain uniform legend styles when working with multiple data sets.
✔️ Simplify Complex Visualizations: Organize information better by segmenting legends.
✔️ Seamless Integration: Works smoothly with ggplot2 and the tidyverse for an efficient workflow.
The visualization shown below is taken from the package website: https://t.co/C2hweizeVT
If you want to learn more about data visualization in R using ggplot2 and its extensions, you might check out my online course on "Data Visualization in R Using ggplot2 & Friends"!
Learn more: https://t.co/ztlEzoEDWv
#statisticsclass #DataAnalytics #datavis #Data #Rpackage #tidyverse #ggplot2 #RStats #DataVisualization
Você conhece o 'brverse' do IPEA? É um repositório organizado pela equipe de dados do @ipeaonline, que compila todas as bases de dados brasileiras dos pacotes em R. Dados e mais dados!
https://t.co/viicmd0185
📊 Want your plots to show the statistics too?ggstatsplot combines beautiful {ggplot2} visualizations with statistical details in a single workflow.#rstats#ggplot2#DataViz#DataScience https://t.co/lRbSHBhWzU
¿Tienes datos geoespaciales con demasiado nivel de detalle? 🗺️
En este tutorial muestro cómo hacer mapas hexagonales o de cuadrícula con R!
Transforma tus mapas a visualizaciones territoriales más simples de interpretar:
https://t.co/gH3y33krW7
Hola🤠 Cómo elijo qué gráfica hacer?
Spoiler: depende de tus datos, no de la que más te guste👀
Datos cualitativos? barras
Datos continuos? histograma
Tiempo? línea
Y si tengo grupos? 🧐
🧵 con 7 casos + código #R listo para copiar
🔗 https://t.co/RLj1XWtWQ2
#CódigoDeTodxs
📊 ¿Conoces R Graph Gallery?
A primera vista parece una colección de gráficos. Más de 400 ejemplos, organizados por tipo, todos con código reproducible. Pero en realidad es un mapa de decisiones.
https://t.co/bIPhviibG0
#stats#DataScience#DataVisualization#RStats#python
se você não usa o geocodebr pra geolocalizar endereços no brasil, eu não sei o que você está fazendo. eu não canso de me embasbacar!
acabei de geolocalizar 460 mil —QUATROCENTOS E SESSENTA MIL— endereços em 20 segundos
é a magia da integração em rust!
https://t.co/pBxR4sePMe
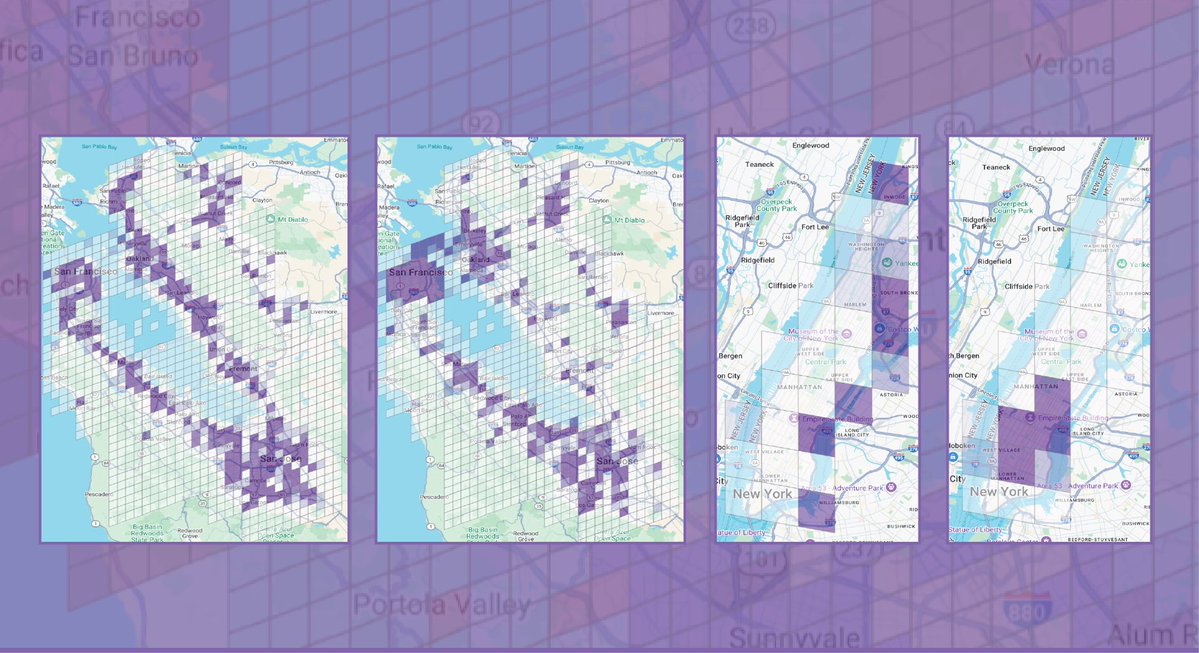
Mapping the modern world: We introduce S2Vec, a self-supervised framework that transforms complex geospatial data into general-purpose embeddings for predicting population density, carbon emissions, and urban development at scale. Check out the blog: https://t.co/xTAos907EC
¿Para qué abrir QGIS si ya tienes R abierto?
Nuevo post: R como sistema de información geográfica, desde cero.
— Shapefiles y GeoPackages explicados sin rodeos
— Cómo importar geometrías y datos tabulares
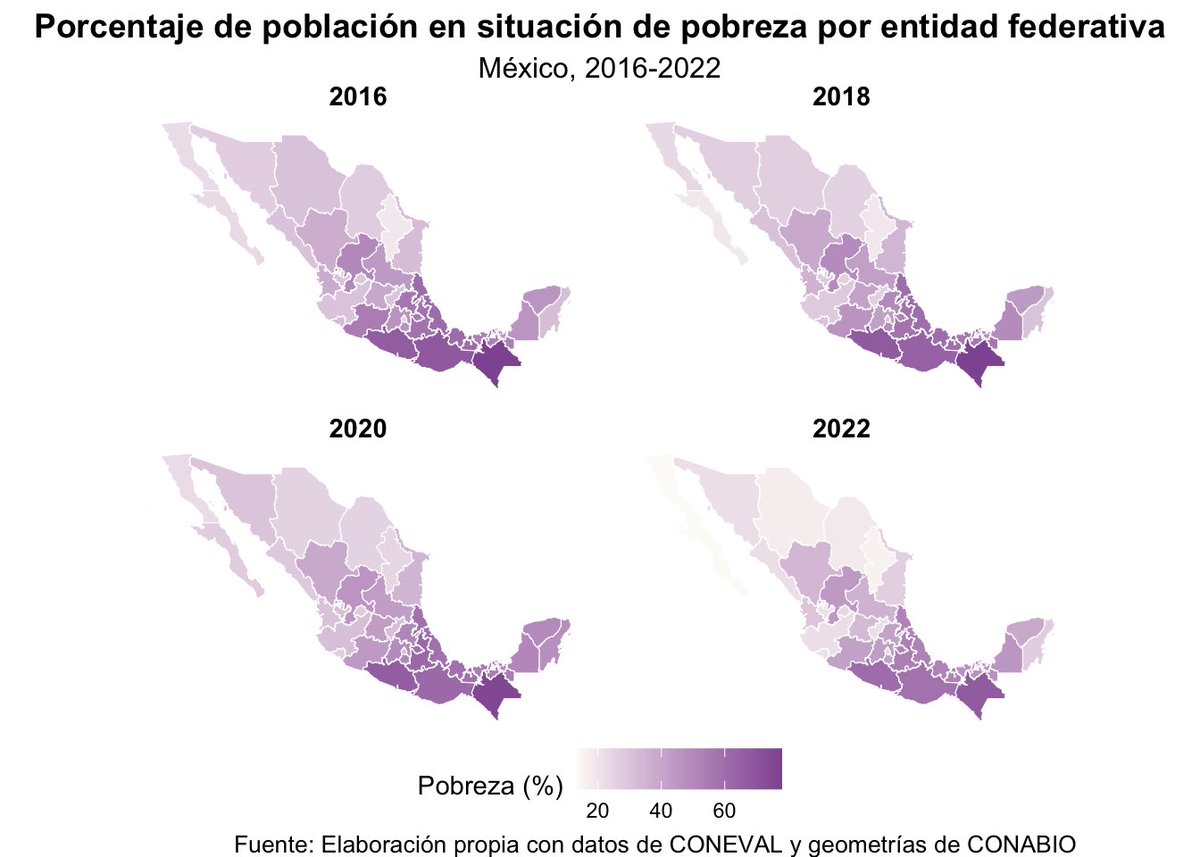
— Mapas coropléticos de México por estado 🗺️🇲🇽
🔗https://t.co/2Xeb7tSng8
Want to earn $4,000+/month and land remote jobs?
Master Excel + Python to automate tasks, analyze data smarter, and get paid in USD.
I created a FREE “Python for Excel” guide—perfect even for beginners.
To get it free:
✓Follow
✓Like & Comment “PEP”
✓Retweet
Have you heard of syndRomics? It is an R package for exploring disease patterns with principal component analysis.
It provides tools for:
🔹selecting components with permutation tests (variance accounted for)
🔹interpreting components through standardized loadings and communalities
🔹assessing stability using bootstrapping with metrics like congruence and RMSE
🔹creating visualizations such as syndromic plots, barmaps, heatmaps, and VAF plots
Compared to regular PCA implementations, syndRomics adds statistical testing, stability assessment, and clear interpretability, making it especially useful for biomedical applications.
The images below, taken from the package website, show syndRomics outputs such as variance accounted for (VAF) plots, component loadings, communalities, and stability assessments. These visualizations help determine which components to retain, how variables contribute, and how robust the results are.
Want to learn more about the package and how to use it? Check it out here: https://t.co/lx7ifkL7XB
Would you also like to dive deeper into PCA? Explore my online course on applying PCA with the R programming language.
More information: https://t.co/DUfoAHuxxD
#Rpackage #RStats #rstudioglobal #Statistics
📚 Hoy ya reúne <<más de 400 títulos gratuitos y de código abierto>> sobre R. Un solo marcador que concentra todo ese conocimiento en un lugar.
🔗 https://t.co/PLHGHEX22U
Quizás este sea el último post sobre libros de R que necesites guardar 😉.
#analytics#book#estadistica
Save. Share. Follow. 😬
🤖 Only 2 DAYS left to register for a FREE AI & Excel Class // links in bio or https://t.co/FJnhsfah3U 🎊
🗂️ Save this post for future reference!
🎯 Follow us on Instagram, YouTube, TikTok, and more // links in bio check us out 😎
#cheatsheets #excel #exceltips #googlesheets #spreadsheets #tutorial