A new infilled global temperature dataset is now available: DCENT_MLE_v1. This dataset estimates more #globalwarming than other datasets: an increase of 1.59 °C from the late 19th century to 2023, with an uncertainty range of [1.48,1.72] °C.
https://t.co/Tbmvpt6End
@EricDLombardi@Ferbin08 Even though this falls outside of provincial jurisdiction, would you be openly against the so-called supply management system that makes milk, eggs, cheese, and poultry unnecessarily expensive, and contributes to both interprovoncial and international trade barriers?
@EricDLombardi Wait, so you mean it isn't the role of the government to arbitrarily favor one religion (catholicism) over other religions and force taxpayers to fund the so-called "education" of this religion while unnecessary duplicating government costs?
@mattkahn1966 As someone who works on both temperature datasets and has an economics background, it is greatly appreciated to see efforts to include measurement uncertainty in econometric models.
@AereOrg As someone who works on both temperature datasets and has an economics background, it is greatly appreciated to see efforts to include measurement uncertainty in econometric models.
@hausfath@RogerPielkeJr That's convenient. GCAM is freely available and doesn't require a GAMS license (unlike the other process-based IAMs). So, that should improve accessibility. My personal experience is that GCAM is not that difficult to use.
@RARohde So to say that RCP8.5 was a 90th percentile likelihood scenario in 2007 is not correct. It would be less likely than that once you account for the preference to publish extreme scenarios and the possibility of mitigation. https://t.co/7p78LE9yEN
@RARohde Moss et al. (2007) listed RCP8.5 as the 90th percentile of no mitigation scenarios, not as a 90th percentile of all scenarios. Also, the distribution of scenarios has a greater variance that of the likelihood distribution since extreme scenarios are more likely to be published.
@hausfath@parkhun@RogerPielkeJr ...policy or technology changes (e.g., declines on solar panel costs). Although, since the high emission scenario involves a repeal of existing climate policy, perhaps forward-looking behaviour results in greater simulated emissions in this case.
@hausfath@parkhun@RogerPielkeJr Was there a rational to assigning the high emissions scenario to a forward looking computable general equilibrium model (WITCH)? Usually, forward looking models are less able to simulate emissions reductions than backward-looking models as firms would not account for future...
@parkhun@hausfath@RogerPielkeJr Thank you for sharing this. I was unaware that the WITCH and COFFEE-TEA models were still being updated. I sent an email to the WITCH team a while ago but never received a response; the WITCH model on their github has been inactive. The WITCH team was occupied with RICE50+ model.
@hausfath@RogerPielkeJr Do we know which IAMs will be selected for each scenario, or is that information not available? Given previous selection, I would expect forward-looking models (REMIND, MESSAGEix) to be used for lower emissions scenarios, with other IAMs (GCAM, AIM, IMAGE) for other scenarios.
@RogerPielkeJr Good to know that paper got published. I read the preprint in 2025, as part of a broader literature review on climate-related scenarios, and it was very helpful.
@FinbarCurtin Regarding spillovers, you can combine bottom up damage estimates with CGE or econometric models (e.g. NiGEM) to model spillovers. I don't understand your claim on bottom up damage can't capture all sectors. Which sector is missing from the following study? https://t.co/QvfqSOKJv6
@FinbarCurtin Can't you use bottom-up damage estimates instead (e.g., estimates from the GIVE or COACHH models) if the top down damage estimates are unreliable?
@FinbarCurtin Yes, the spatial pattern of ENSO (more warming in the tropical pacific and near the surface) is very different from the spatial pattern of long term warming (more warming in arctic land or sea ice regions, and in the upper troposphere). This causes different climate effects.
@mattkahn1966 To clarify, I was highlighting this paper regarding warming until the present rather than predictions of future warming. It can be helpful to researchers to know the current state of the literature. I have appreciated some of your past work (e.g., https://t.co/F0rk4VpWMh).
@mattkahn1966 Hi Dr. Kahn,
Please see the latest community science assessment on how close we are to the 1.5°C warming target. While our consensus estimates have some caveats (e.g., excluding nearly 0.1°C warming prior to 1850), it can be a helpful point of reference. https://t.co/uvbi3mGf6t
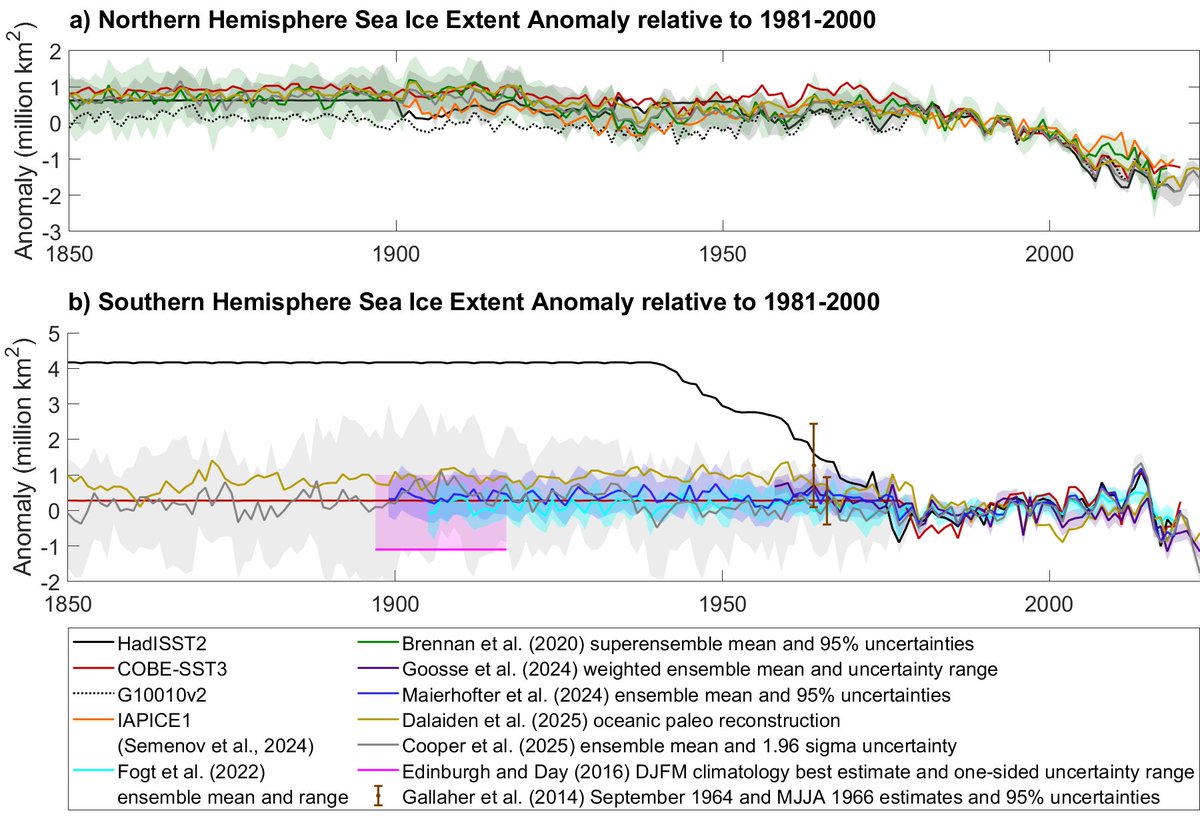
I intended for the graph to be accessible to red-green colorblind people, but authors kept finding additional recent reconstructions. Here is my attempt at a colorblind accessible version. Feedback would be welcome. The community paper is open for public comment until March 11.
Regarding a recent community science paper on 1.5°C of #globalwarming (https://t.co/IRY1gGSDh9), the graph I like the most shows #seaice extent anomalies for different datasets and reconstructions. The most striking feature is HadISST2 disagreement with Antarctic reconstructions.
However, many other datasets might underestimate #warming despite using HadISST2 since they often don’t account for climatological differences between #seaice and open sea. This issue is discussed in section 3 of the paper as well as in my 2024 paper (https://t.co/s3f9EfMOsi).


![BruceTTCalvert's tweet photo. A new infilled global temperature dataset is now available: DCENT_MLE_v1. This dataset estimates more #globalwarming than other datasets: an increase of 1.59 °C from the late 19th century to 2023, with an uncertainty range of [1.48,1.72] °C.
https://t.co/Tbmvpt6End https://t.co/ij8tDiV2Ri](https://pbs.twimg.com/media/GY7e4vqWsAEXlGv.png)