Pat Dorsey created Morningstar’s moat framework before founding Dorsey Asset Management, a $1.7B global public equity manager. Listen to hear how he thinks about competitive advantages, reinvestment runways, & applying moat analysis in practice.
https://t.co/xa3BIA82SU
With thanks to @AlphaSenseInc, @LongAngleHNW, @AdmiredLeaders, & Morgan Stanley Investment Management.
Here's my full interview with CNBC, covering my bear case against generative AI, OpenAI's questionable finances, AI's lack of ROI, and how all of this is a symptom of the tech industry running out of hypergrowth ideas.
It's great to see the mainstream media discussing this.
"Soros is the best loss taker I've ever seen. He doesn't care whether he wins or loses on a trade. If a trade doesn't work, he's confident enough about his ability to win on other trades. There are a lot of shoes on the shelf; wear only the ones that fit. If you're extremely confident, taking a loss doesn't bother you."
Stanley Druckenmiller
So let me get this straight...
1) Semiconductor stocks are up 107% this year.
2) The Mag 7 names are down 8% because they're spending hundreds of billions on semiconductors.
3) The market expects this capex cycle to continue indefinitely.
Have I got that right?
Pure risk appetite inside the S&P 500.
SPHBI is the S&P 500 High Beta Index—the 100 stocks in the S&P 500 most sensitive to market moves (they rise and fall harder than the index). SPLVI is the S&P 500 Low Volatility Index—the 100 most stable, defensive names.
The market is unambiguously risk-on, and at an extreme. Investors are aggressively favoring the most volatile, highest-beta names over defensive ones, and they've been doing so for the better part of a year (+67% ROC). This is what a strong, momentum-driven bull market looks like under the hood: big risk appetite, defensives left behind.
The extremity is double-edged. The two prior times this ROC spiked to similar heights (2010 and 2021) both marked moments where the high-beta leadership soon stalled or reversed. A ratio at all-time highs with a near-record one-year surge says the trade is crowded and stretched, not that it's about to end, but historically these readings are where the risk/reward of chasing high beta gets worse.
Peter Lynch: “You have to be looking for new companies and look at the balance sheet.
If you can add 5 and 5 and get reasonably close to 10, you should be able to look at a balance sheet and say: here are 2 depressed companies, they’ve gone from $50 to $3 dollars.
One company’s got $300 million in cash and no debt. One’s got $300 million in debt and no cash.
Which one are you gonna buy? Not too hard.”
Keep it simple.
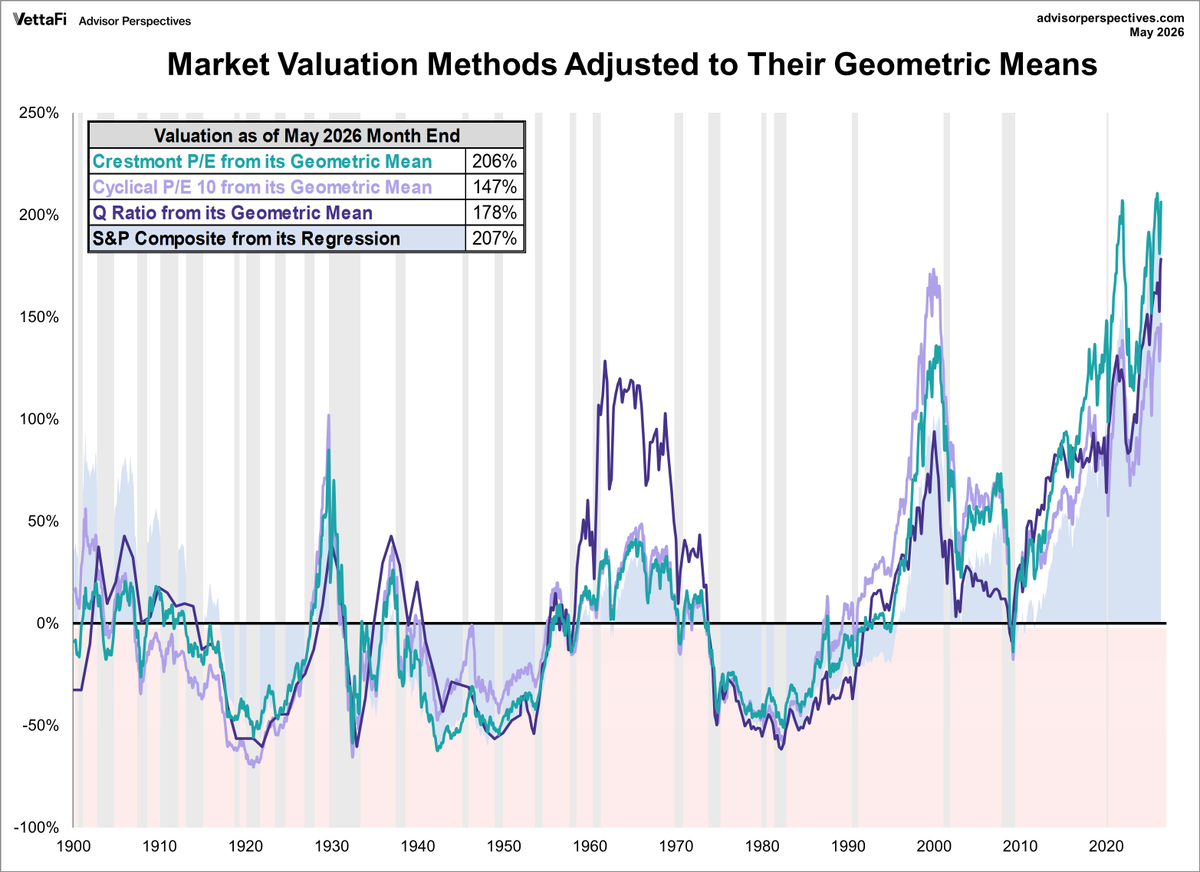
dot-com bubble vs. a possible AI bubble.
From the famous "Dean of Valuation", Professor Aswath Damodaran, of NYU Stern School of Business,
“And that’s the real big difference between the dot-com boom and bust and the AI boom. We don’t know whether there’ll be a bust. History suggests there will be a bust.
The dot-com boom and bust had no huge capital expenditure in that cycle. In fact, there was very little traditional CapEx, or even R&D, driving it. People started apps. They basically started going on it.
This has been the biggest infrastructure run-up I think I’ve ever seen in business. You can go back and compare it to the automobile business 100 years ago. The amount of money that’s being put into AI CapEx is immense, which means that when the correction comes, the pain will be more intense.
And herein lies the second problem. The dot-com boom and bust was almost entirely equity-funded. You think, so what? Well, when the bust came, those shareholders lost 60%, 70%, 80%, or 90% of their money. You felt sorry for them, but the loss was restricted to the shareholders.
The problem with the AI CapEx boom is that not only is it immense, but a big chunk of it is funded with debt, and the debt is coming from private capital rather than banks. There’s a very real chance that if there’s a correction and companies start having problems, that problem is going to show up as distress and default, and that really doesn’t stay restricted. It spills over into the rest of society.
I’m not saying it’s going to be 2008, but 2008 is an example of what happens when lenders overreach, when they lend money at too low a rate, and the correction comes. The pain spills over.
So that is my concern with this big market illusion: the potential societal cost of having to deal with debt coming due that you’re unable to pay. It’s much more painful than your share price dropping 90% and you feeling the pain."
----
From "Excess Returns" YouTube channel, (link in comment)
Druckenmiller and Bessent wanted to bet $3 billion against the Bank of England - Soros said that's not enough and pushed it to $10 billion
they showed how exactly that day unfolded - two traders made $1 billion in one day
two men who trained the current US Treasury Secretary - in one video that nobody has seen
they shorted the British pound until the Bank of England ran out of money defending it - $6 billion gone in one day
then Druckenmiller left - and went 30 years without a single losing year
Bessent and Soros stayed together - 20 years later they crushed the Japanese economy
this documentary will change how you think about risk forever
bookmark & watch today ↓
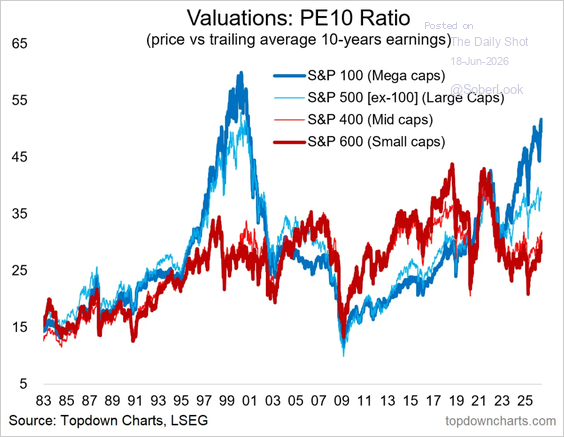
The valuation gap between mega caps and the rest of the market is approaching dot-com extremes
“The market is expensive” really means: the largest stocks are expensive
The opportunity is in what the index is hiding
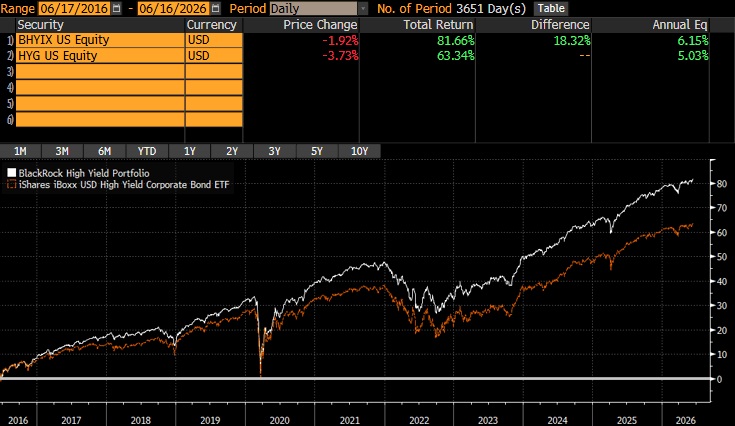
Mutual Funds vs ETFs
For high yield bonds...
Blackrock's mutual fund, beats their ETF by 1.12% annualized over the last ten years. Fixed income ETFs, where the underlying isn't as liquid as the ticker, lose value due to bid-ask, illiquidity and trading costs.
This was ABSOLUTELY INCREDIBLE.
Just listened to it after hearing the glowing reviews. Unbelievably good. A masterclass in growth investing filled to the brim with insights from an investor with a track record that speaks for itself.
Very interesting and scary report from Morgan Stanley
The financial engineering behind hyperscaler capex
The truly unsettling part of the AI boom isn’t how much money is being spent
It’s how that money is being engineered through accounting
Hidden liabilities (> $1.8T)
Huge obligations sit off‑balance‑sheet: nearly $1T in purchase commitments, $800B+ in leases not yet started, $2T+ in RPO.
Future cash outflows that don’t show up as debt.
The coming depreciation hit
Profits look good only because spending is stuck in CIP.
Big Tech faces $520B+ in depreciation over 3 years.
ORCL’s depreciation ratio: 7% → 28%.
Supplier financing pressure
Unpaid capex is ~$110B.
ORCL’s DPO exploded from 35 → 170 days.
The whole supply chain is effectively financing the AI build‑out.
Lease accounting gray zones
Whether GPU contracts count as leases or services is subjective — and companies use that flexibility to shift billions on/off the balance sheet.
$ORCL = the most aggressive
Largest lease commitments, RPO up 300%+, capex‑to‑sales hitting 189%.
Oracle is running the highest financial leverage in the ecosystem.
Billionaire investor Ron Baron explained the silent math destroying your wealth:
Your money loses 4 to 5% of its purchasing power every single year. The economy grinds higher at roughly 2%. That is a relentless 7% headwind against you, annually.
What that really means. Prices double every 10 to 12 years. Your savings are cut in half in real terms within about 15 years. Cash sitting idle is not safe, it is decaying.
The system is structurally engineered to punish savers and force capital into risk just to survive.