Business & law grad. Former PM of student-led Richmond Capital Partners. Currently managing my own portfolio, with a 180% return over the last twelve months.
From Sep24' to Mar25', I served as a PM at RCP, my university's largest student-led investment fund by AUM. RCP outperformed SPY by over 3% through Mar 31. We went cash in mid-March, avoiding the Liberation Day crash. Performance report attached.
https://t.co/3tzKR2Qk48
I added 16% to my $OSCR position yesterday at $20.48, very close to the 0.382 Wave Two retracement level of $19.65 which I identified in the attached post. It was my first crack at technical analysis, and probably more luck than skill that it worked out so well today.
As I previously stated, I expect Oscar’s Wave Two pullback to be on the shallow side given its severe undervaluation relative to management guidance.
The formula to keep repeating: $20bn sales in FY2027, 5% operating profit margins, $1bn in operating income, 283mm shares outstanding, $3.75 FY2027 EPS, 20x multiple, $70 a share.
I have seen some interesting posts explaining the recent weakness in $OSCR via Elliott Wave theory. Specifically, Oscar stock has sold off 13% since reaching $25.30 on May 18. Over this same period the S&P 500 is up 1.6%, so Oscar’s weakness cannot be attributed to broader market trends.
From what I understand, Wave 1 of Elliott Wave theory (the initial rally stage) likely began on April 6, 2026, when Oscar CEO Mark Bertolini purchased 1 million shares at $11.92.
From there, OSCR rallied from roughly $11 to $25 following strong Q1 earnings and improving confidence around the company’s path to profitability.
If that interpretation is correct, the current weakness in Oscar is likely a Wave 2 correction rather than the start of a new bear trend. Historically, Wave 2 retracements tend to retrace 38–62% of Wave 1, implying support somewhere in roughly the $16–19 range.
My view is that the retracement likely ends up on the shallower side of that range for Oscar (38% retracement to ~$19.65 and at most a 50% retracement to ~$18 a share) as the fundamentals underneath its ascent from $11–$25/share appear materially stronger than the typical speculative Wave 1 rally.
Specifically, as I have noted in prior posts, if you apply 2024 seasonality to OSCR’s Q1 2026 MLR, the company appears on pace for a sub-80% full-year MLR — which would represent a major profitability inflection for the business. At the same time, both Raymond James and Barclays recently raised their price targets to $30, suggesting improving institutional confidence is already beginning to emerge.
That’s important because Wave 3s are usually the phase where fundamentals begin validating the price action and institutional participation broadens materially. In many cases, Wave 1 is driven primarily by early believers and sentiment shifts, while Wave 3 is where institutions, analysts, and momentum investors begin aggressively repricing the company as the financials materially improve. Historically, this is often the longest and most powerful phase of the Elliott Wave cycle because both earnings expectations and valuation multiples expand simultaneously.
If OSCR successfully bases in the retracement zone and eventually reclaims the highs, I think a larger Wave 3 toward ~$70 is more plausible than most appreciate today.
Management communication re guidance is very poor. Additionally the market is discounting $WRD relative to domestic competitor $PONY due to Pony’s higher trips-per-day and vehicle count for its Chinese robotaxis. The market fails to understand that WeRide is not prioritizing China, and this is why Pony is having more success in the Chinese market.
The market will begin to wake up once product revenue from sales of WeRide robotaxis and robobuses to overseas fleet operators surpass Pony.
My guess is as good as yours for when that occurs, which is why I view right now as the consolidation phase.
@LDDBCap It’s totally possible, I would have to be off by a lot to justify current prices in my opinion - I think there are better opportunities elsewhere.
I've seen a number of posts recently recommending $TTWO as an attractive way to play GTA VI.
Personally, I am staying away at current prices (but am open to rebuttals in the comments if anyone believes my assumptions are low).
My hesitation is not rooted in a belief that GTA VI will disappoint. In fact, I think it will likely become the biggest game launch in history.
The issue is valuation.
$TTWO's market cap is already over $40B, which means investors aren't buying an undiscovered opportunity. They're paying upfront for years of expected success.
The bull case is straightforward:
• GTA VI launches in November 2026
• FY27 revenue reaches ~$8B
• FY28 revenue approaches $9-10B as GTA Online ramps
• Rockstar monetizes the title for years, potentially a decade
All of that sounds reasonable.
The problem is that the stock already reflects much of this outcome.
Let's run a simple valuation exercise.
Assume FY28 revenue of $9.2B and EBITDA of $1.6B—an outcome that would represent enormous success for the company and a meaningful step-up from historical profitability.
Most large publishers trade around 12-18x EBITDA.
At 15x EBITDA, $TTWO would be worth roughly $25B in enterprise value.
Even at 18x EBITDA, you're still below where the company trades today.
You can also look at earnings.
Assume FY28 EPS reaches $5.00.
A mature publisher like Electronic Arts would typically trade around 15-18x earnings.
Even assigning $TTWO a premium 25x multiple because of GTA's franchise value only gets you to roughly $125/share.
I have made the same chart for $DLO since it went public.
I expect dLocal's FCF-per-share to expand at a 26% CAGR between 2026 and 2030, bringing FCF-per-share from $0.66 in 2025 to $2.15 in 2030. At a 20x multiple of FCF-per-share, I forecast that dLocal will be worth north of $43-per-share by 2030.
Today, dLocal director Will Prueet purchased $237 thousand of shares, marking the first insider purchase of dLocal stock since the company's IPO in 2021.
Insider buying after a prolonged period of remaining on the sidelines gives me confidence that the market is discounting dLocal's fair value and the operating leverage which the business will begin to realize in the second half of 2026.
Buffett and Terry Smith agree on one thing:
FCF/share is king.
It measures how much cash a business generates for each shareholder.
Here are 6 modern-day FCF/share compounding machines:
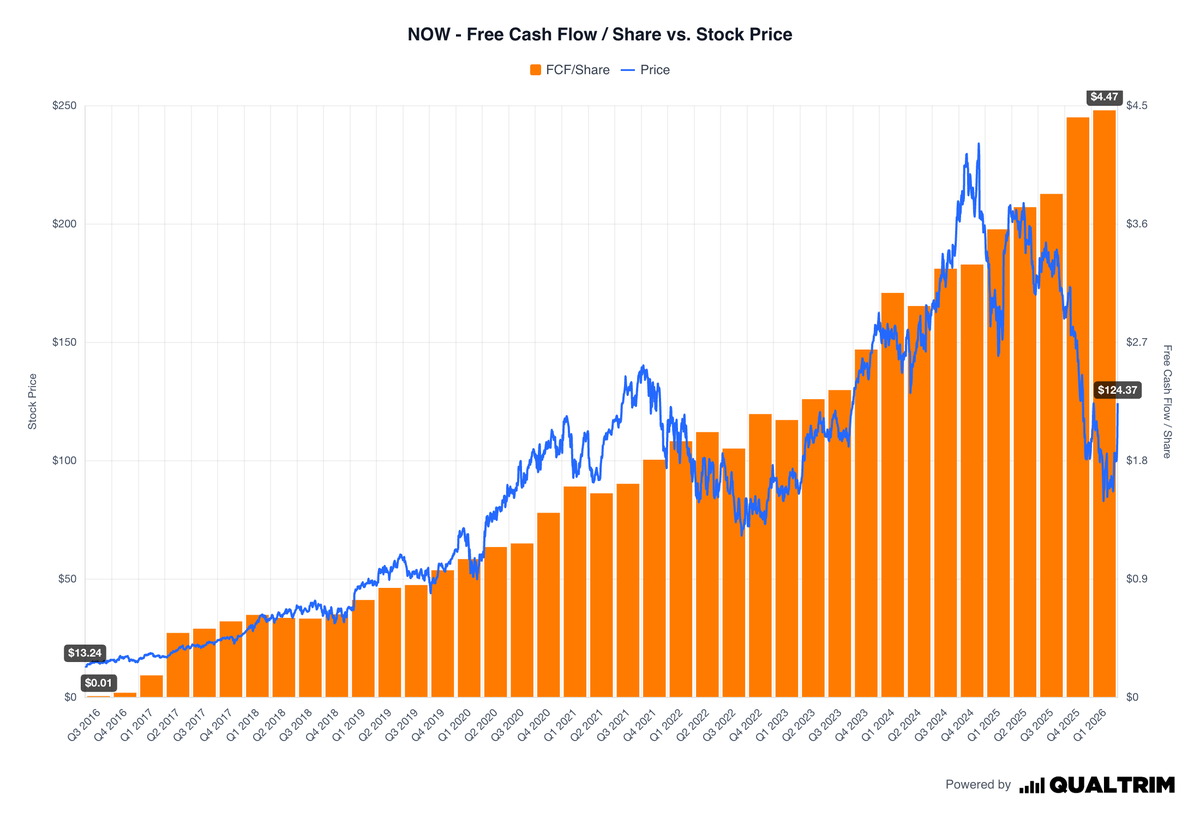
1) ServiceNow – $NOW:
While the Madrid announcement is a positive signal for $WRD, it was already priced into the stock. However, the press release does contain substantive, novel guidance which I will explain below after first summarizing WeRide's entrance into Madrid.
Summary of the Madrid Announcement
Today, WeRide, Uber, and local fleet operator AVOMO have announced the launch of Spain's first commercial robotaxi pilot in the Region of Madrid, with public rides expected later this year via the Uber app.
The service will initially include trained vehicle operators before scaling toward fully driverless commercial operations across core urban areas. The rollout is backed by the Madrid Regional Government and powered by WeRide's autonomous driving technology, with AVOMO — Moove Cars Group's AV operations arm, already managing roughly 400 autonomous vehicles across Austin and Atlanta — handling fleet operations on the ground.
Madrid represents WeRide's fifth European market entry, following France, Switzerland, Belgium, and Slovakia. Critically, it also marks the fourth city unlocked under WeRide and Uber's broader partnership agreement, which targets 15 cities by 2030, with another 11 still to come.
A Statement Worth Pausing On
The key quote from the press release deserves careful attention:
"This marks the fourth of the 15 cities outlined under WeRide and Uber's previous agreement, with another 11 cities to come by 2030. Under this partnership, they plan to deploy tens of thousands of Robotaxis..."
By bolding "fourth" and "tens of thousands," WeRide is communicating two things simultaneously: how early we are in this rollout, and how large the eventual fleet will be. This is exactly the kind of deliberate, specific language which I called for management to disclose following their Q1 2026 earnings call.
Before this press release, a sceptic could reasonably argue that when WeRide guided for a robotaxi fleet size in the "tens of thousands" by 2030, the majority of these robotaxis would be in the low-profit Chinese market (which currently accounts for greater than 66% of WeRide's total robotaxi fleet).
This press release closes that interpretation. WeRide is explicitly stating that the Uber partnership alone will deploy tens of thousands of robotaxis. That means tens of thousands of vehicles in the highest-margin, highest-yield segment of WeRide's business. The Chinese domestic fleet, the Grab partnership, and any future ride-hailing agreements are entirely additive to this figure.
From a modelling standpoint, this is a significant derisking event. We now have a contractual floor — 15 cities, tens of thousands of vehicles — anchored to WeRide's single largest international partner, with a credible operational track record already established in Riyadh, Abu Dhabi, Dubai, and now Madrid. The ambiguity that previously made the international revenue ramp difficult to underwrite with conviction has been substantially reduced.
What Does the Full Partnership Look Like at Scale?
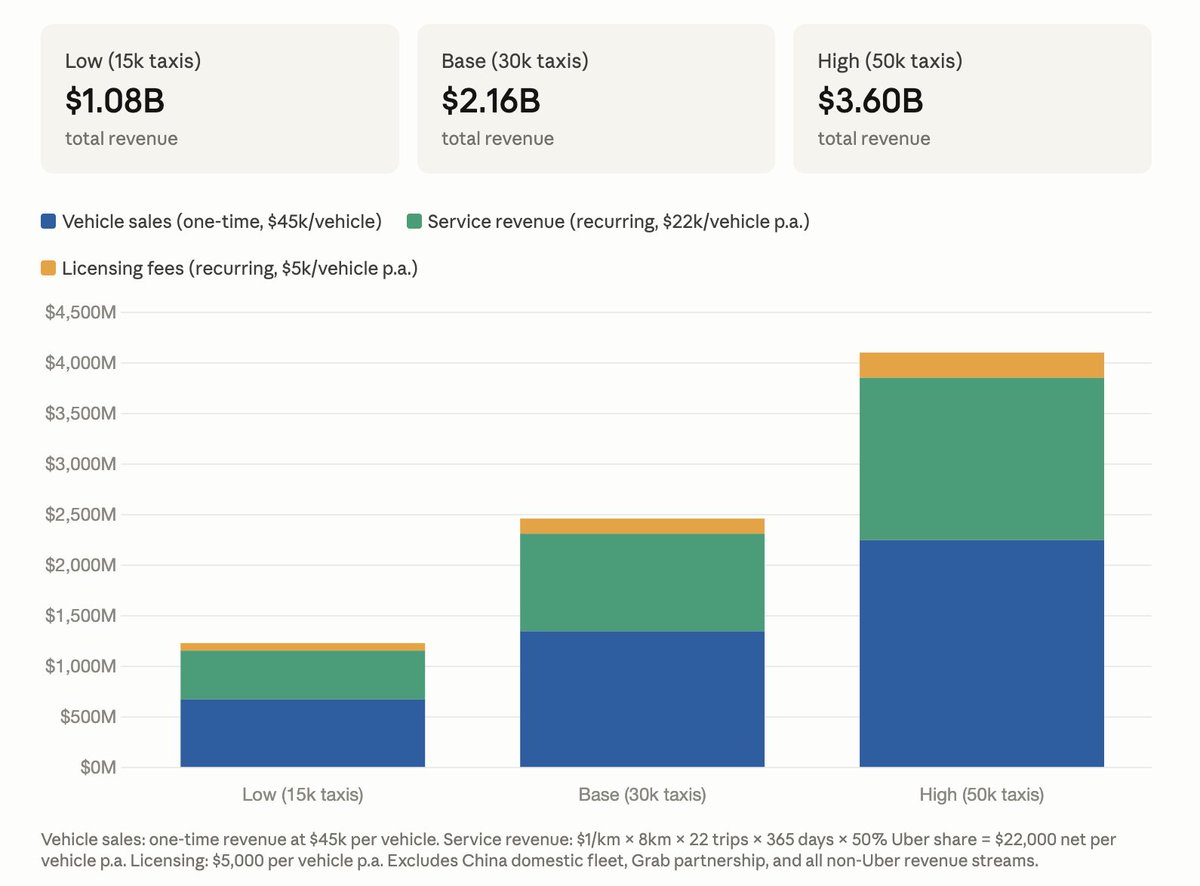
Using unit economics of US$1/km, 8km per trip, 22 trips per day, and a 50% revenue share with Uber, each robotaxi generates approximately US$22,000 in net annual service revenue for WeRide, plus US$5,000 in annual licensing fees and a one-time US$45,000 vehicle sale.
I have applied these assumptions across three fleet scenarios by 2030 in the attached chart:
Specifically, at 15,000 robotaxis, total revenue reaches approximately US$1.08B, comprised of US$675M in one-time vehicle sales, US$330M in annual service revenue, and US$75M in annual licensing fees.
At 30,000 vehicles those figures roughly double to US$2.16B in total, with US$1.35B in vehicle sales and US$810M in combined recurring revenue.
At the high end — 50,000 robotaxis across 15 cities — total revenue approaches US$3.60B, with US$2.25B in vehicle sales and US$1.35B in recurring service and licensing income. These numbers sit entirely within the Uber partnership and exclude China, Grab, and any future agreements.
From the Middle East to Europe – WeRide and @Uber bring Robotaxis to Madrid. 🇪🇸 Our first joint European launch, with rides available via the Uber app. Commercial operations expected later this year, in collaboration with Comunidad de Madrid and AVOMO.
$WRD
After listening to $SOFI CEO Anthony Noto’s appearance on the Basis Points podcast with @amitisinvesting last week, I decided to take a deeper look into the inner workings of SoFi’s business and attempt to value the company.
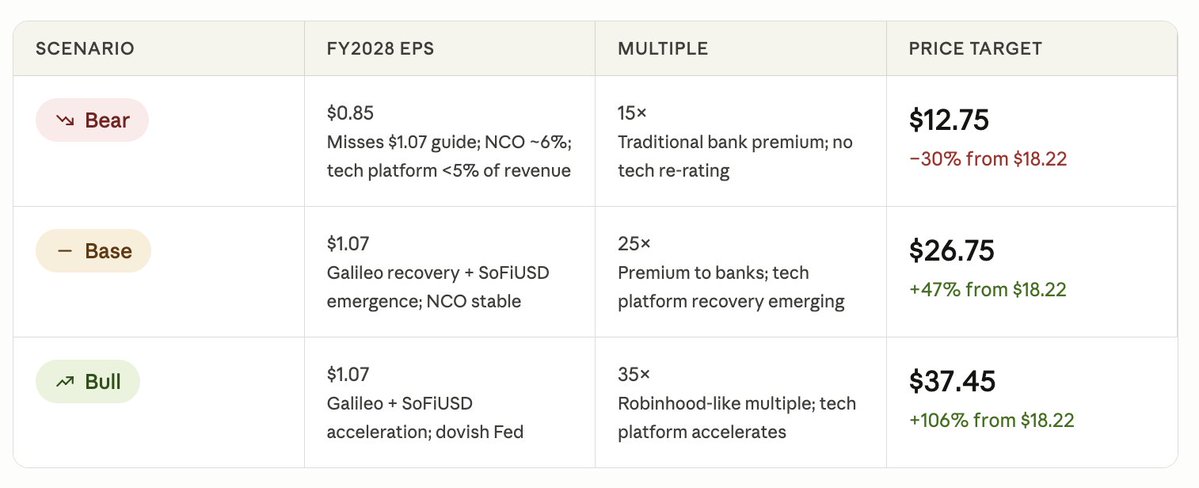
It quickly became apparent that SoFi’s YTD decline of 30% as of market close on May 29, 2026 is detached from the Company’s strong Q4 2025 and Q1 2026 results. Specifically, in Q1 2026 SoFi generated $1.1 billion of revenue (up 43% YoY), $340 million of adjusted EBITDA (up 62% YoY) at a 31% margin, and $167 million of GAAP net income. Further, company management has guided for full-year 2026 revenue of $4.655 billion (+30% YoY), EBITDA of $1.6 billion, and EPS of $0.60. Management expects this strong performance to continue in the coming years, with a 2028 EPS forecast in the $1.02–$1.12 range.
The sell-off in SoFi’s stock since reaching all-time highs in November 2025 appears to be rooted in two factors: (i) an unexpected deceleration of the Company’s Galileo business to 7% of group revenue; and (ii) rising charge-off rates on SoFi’s loan book occurring within the context of a worsening macro environment for the consumer.
In the linked report I: (i) provide an overview of SoFi’s business and its three revenue drivers; (ii) evaluate the implications (and likelihood) of Galileo deceleration, stablecoin issuance becoming a primary revenue stream and charge-off rate acceleration on SoFi’s valuation; and (iii) conclude with my price target for the Company
I have attached bear, base, and bull price targets to this post.
I have seen some interesting posts explaining the recent weakness in $OSCR via Elliott Wave theory. Specifically, Oscar stock has sold off 13% since reaching $25.30 on May 18. Over this same period the S&P 500 is up 1.6%, so Oscar’s weakness cannot be attributed to broader market trends.
From what I understand, Wave 1 of Elliott Wave theory (the initial rally stage) likely began on April 6, 2026, when Oscar CEO Mark Bertolini purchased 1 million shares at $11.92.
From there, OSCR rallied from roughly $11 to $25 following strong Q1 earnings and improving confidence around the company’s path to profitability.
If that interpretation is correct, the current weakness in Oscar is likely a Wave 2 correction rather than the start of a new bear trend. Historically, Wave 2 retracements tend to retrace 38–62% of Wave 1, implying support somewhere in roughly the $16–19 range.
My view is that the retracement likely ends up on the shallower side of that range for Oscar (38% retracement to ~$19.65 and at most a 50% retracement to ~$18 a share) as the fundamentals underneath its ascent from $11–$25/share appear materially stronger than the typical speculative Wave 1 rally.
Specifically, as I have noted in prior posts, if you apply 2024 seasonality to OSCR’s Q1 2026 MLR, the company appears on pace for a sub-80% full-year MLR — which would represent a major profitability inflection for the business. At the same time, both Raymond James and Barclays recently raised their price targets to $30, suggesting improving institutional confidence is already beginning to emerge.
That’s important because Wave 3s are usually the phase where fundamentals begin validating the price action and institutional participation broadens materially. In many cases, Wave 1 is driven primarily by early believers and sentiment shifts, while Wave 3 is where institutions, analysts, and momentum investors begin aggressively repricing the company as the financials materially improve. Historically, this is often the longest and most powerful phase of the Elliott Wave cycle because both earnings expectations and valuation multiples expand simultaneously.
If OSCR successfully bases in the retracement zone and eventually reclaims the highs, I think a larger Wave 3 toward ~$70 is more plausible than most appreciate today.
I made an error in my original post framing the $RNECY trade as a four-year hold. The right way to think about it is as a re-rating of 2028 non-GAAP earnings — but my conclusion that the remaining upside is limited stands either way.
After today's 12% surge, Renesas is trading at approximately 18x its forecasted 2028 non-GAAP earnings of ~$3B, implying a total market cap of ~$53.5B. That is already a premium to the mid-teens multiples applied to cyclical semi peers such as ON, NXP, Infineon and ST — which tells you the market has started pricing in Renesas' AI infrastructure exposure.
The attached table outlines the bear, base and bull cases for Renesas' AI infrastructure net profit in 2030, and the valuation implication of each. The key number is in the bull case: even if MRDIMM adoption accelerates to 60% of the server memory market by 2030, AI infrastructure earnings represent only 12% of Renesas' total projected net profit. The business is still overwhelmingly automotive and industrial. Applying 35x to the AI infrastructure earnings and 15x to the rest of the business gives an implied market cap of approximately $63B in the bull case — roughly 17% above today's $53.5B.
The more relevant valuation anchor is the 2028 earnings multiple. If the market fully prices in the bull case AI infrastructure contribution and re-rates Renesas from 18x to 22x on 2028 non-GAAP earnings of ~$3B, the implied market cap reaches approximately $66B — or roughly 23% above today. That is probably the ceiling. A lot of the upside has already been captured.
NOTE: I am open to any criticism if others see this differently.
Deep-Dive - $RNECY / 6723.T (Potential Agentic CPU-Bottleneck Play)
I spent some time this weekend looking into Renesas after seeing it flagged by @yianisz as a dark-horse way to play the CPU trade. My thoughts are below.
Renesas Current Valuation
At first glance, Renesas does not look like a company which would benefit from the AI infrastructure buildout. It is predominantly a Japanese automotive and industrial semiconductor company. DDR5 DIMM-interface exposure (which I will explain in layman's terms below) likely accounted for less than 5% of Renesas' US$9.2B in FY2025 revenue.
As a result of its revenue composition, Renesas trades at ~12–16x its 2027–2028 consensus non-GAAP earnings estimates, in line with cyclical semi peers such as ON, NXP, Infineon and ST. At these mid-teens multiples, the market is pricing each of these businesses as cyclical — earnings tied to auto production, industrial capex, and macro swings rather than secular growth.
Structural AI infrastructure names — Nvidia, Broadcom's AI networking business, Marvell's AI attach franchises — command 25–40x+ multiples of their 2027–2028 consensus non-GAAP earnings estimates, reflecting the market's view that those earnings are attached to long-duration secular AI infrastructure growth rather than the next macro cycle.
The CPU Opportunity
As CPU server TAM expands towards $200 billion in 2030 and DIMM-interface revenues grow to represent a more meaningful portion of Renesas' total annual revenue, the market may begin to price the Company more like a structural AI infrastructure name and less like a cyclical auto/industrial semi company.
Renesas' CPU Exposure
Renesas participates in the memory-interface layer of server DIMMs. These are not CPUs or GPUs. They are the support chips — PMICs, SPD hubs, clock devices, register and buffer chips — that sit on each memory module and make high-performance memory work reliably.
To understand what this exposure means, it helps to simplify what a modern server actually looks like.
A CPU is essentially the brain of a server, but a brain cannot work without short-term memory. That short-term memory is RAM, and in servers, RAM comes on small circuit boards called DIMMs — effectively server-grade memory sticks plugged into the motherboard.
Each DIMM contains the actual memory chips, but it also contains several smaller support chips that make the memory function properly. One of the most important is the PMIC — Power Management Integrated Circuit. Renesas currently has 65-70% share over the PMIC market.
A PMIC is basically a precision electrical regulator. Memory chips require extremely stable voltage and carefully managed power delivery. Without that, they do not work reliably. The PMIC’s job is to regulate that electricity at the DIMM level.
A modern CPU server may contain dozens of DIMMs. Each DIMM may contain a PMIC, plus additional interface chips such as SPD hubs, clock devices, or data buffers. That means CPU server growth often translates into:
more DIMMs
more memory interface silicon
more PMIC sockets
more content opportunity for Renesas.
**Notably, Renesas would not share the same upside in the GPU buildout given that GPUs rely heavily on HBM, which is a different memory architecture and supply chain.
Valuation
Nvidia CEO Jensen Huang stated on the Company's Q1 2026 earnings call that CPU server TAM could approach $200B by 2030. At a ~$25K server average selling price, that implies roughly 8 million server-equivalent units annually by 2030.
To understand what that means for Renesas, you need to build it up from the DIMM level — and then place that opportunity in the context of what the rest of the business is likely worth by 2030.
Part 1 - Renesas AI Infrastructure Non-GAAP Net Profit (2030)
A dual-socket CPU server supports 16 memory channels in total, with up to 2 DIMMs per channel. In practice, most servers are configured somewhere between 16 and 24 populated DIMMs depending on the workload. Each of those DIMMs carries a fixed set of Renesas support chips. On a standard DDR5 RDIMM there is 1 PMIC, 1 SPD hub, and 1 registered clock driver — roughly $7.50 of Renesas content per module. On a next-generation MRDIMM, which doubles memory bandwidth by multiplexing two ranks of DRAM, the chipset expands significantly: 1 MRCD, 10 multiplexed data buffers, plus the same PMIC and SPD hub — bringing total Renesas content to roughly $14 per DIMM. Renesas is currently the only supplier offering the complete MRDIMM stack end-to-end.
MRDIMMs are still roughly 6% of the server memory market today, but the trajectory is clear. Intel's roadmap through 2030 is explicitly MRDIMM-forward — Clearwater Forest (2026), Diamond Rapids (2027, with 16-channel MRDIMM Gen 2 pushing bandwidth to ~1.6 TB/s), and Coral Rapids (2028) all require or favour MRDIMM for high-performance builds. With that in mind, the three scenarios below blend RDIMM and MRDIMM adoption explicitly.
Bear Case — 15% MRDIMM by 2030
Servers average 16 DIMMs. Blended Renesas content per DIMM of ~$8.50. At 65% PMIC socket share, roughly $88 of content per server. Across 8 million units, approximately $705M of incremental AI infrastructure revenue. At 35% operating margins, the AI infra operating profit contribution is around $247M. Applying a 30% effective tax rate, non-GAAP net profit for Renesas' AI-infrastructure segment in this scenario is $173M.
Base Case — 35% MRDIMM by 2030
Servers average 20 DIMMs. Blended content per DIMM rises to ~$10.15 as the growing MRDIMM share lifts the per-module average. At 67.5% PMIC socket share, roughly $137 of content per server. Across 8 million units, approximately $1.1B of incremental AI infrastructure revenue. Operating profit contribution at 35% margins is around $384M. Applying a 30% effective tax rate, non-GAAP net profit for Renesas' AI-infrastructure segment in this scenario is $269M.
Bull Case — 60% MRDIMM BY 2030
Servers average 24 DIMMs. Blended content per DIMM rises to ~$11.85. At 70% PMIC socket share, roughly $199 of content per server. Across 8 million units, approximately $1.6B of incremental AI infrastructure revenue. Operating profit contribution at 35% margins is around $559M. Applying a 30% effective tax rate, non-GAAP net profit for Renesas' AI-infrastructure segment in this scenario is $391M.
Part 2- Renesas Other Businesses Non-GAAP Net Profit (2030)
Consensus estimates have Renesas reaching approximately $3B in non-GAAP net profit by 2028 — roughly a 23% CAGR from FY2025's ~$1.61B non-GAAP net profit. However, that $3B figure already embeds some AI infrastructure revenue within the IIoT segment calculated in Part 1 of this analysis. Stripping that out conservatively reduces Renesas' 2028 non-GAAP net profit to ~$2.7B.
Applying a 10% CAGR from 2028 to 2030, Renesas' 2030 non-GAAP net profit is forecasted to be ~$3.27B before any incremental AI infrastructure contribution from Part 1 is layered on top.
Part 3 - Applying AI Infrastructure Bear, Base and Bull Cases to Renesas' Other Businesses Operating Profit
Applying the AI infrastructure non-GAAP net profit contribution to Renesas' $3.27B base results in the following blended 2030 net profit and implied market cap for Renesas.
Bear Case — ~$50B Implied Market Cap
Blended 2030 non-GAAP net profit of approximately $3.44B — the $3.27B base plus $173M of AI infrastructure net profit. At 15x P/E — the market continues pricing Renesas as a purely cyclical semi with no AI premium — the implied market cap is approximately $51.6B, roughly flat relative to current price of Renesas' shares.
Base case — $65B Implied Market Cap
Blended 2030 non-GAAP net profit of approximately $3.54B — the $3.27B base plus $269M of AI infrastructure net profit. At 18x P/E — a partial re-rating as investors begin assigning AI attach value, similar to where Marvell traded before its AI thesis was fully priced — the implied market cap is approximately $63.7B, or roughly 30% above today. At 20x, the implied market cap reaches ~$70.8B, or approximately 40% above today.
Bull Case — Implied Market Cap
Blended 2030 non-GAAP net profit of approximately $3.66B — the $3.27B base plus $391M of AI infrastructure net profit. At 22x P/E — MRDIMM dominance and a ~$1.6B AI infrastructure revenue stream causes the market to assign a structurally higher multiple on a growing portion of earnings, still well below pure-play AI names — the implied market cap is approximately $80.5B, or roughly 61% above today. At 24x — which requires the market to genuinely begin reclassifying a portion of Renesas' earnings as AI infrastructure rather than cyclical, which is unlikely given that in the bull case AI infrastructure earnings will only account for 12% of Renesas total non-GAAP net profit — Renesas' implied market cap reaches ~$87.8B, or approximately 78% above today.
Conclusion
At its current $50B market cap, much of the CPU-linked upside is already priced into Renesas' stock.
Even in the bull case, AI infrastructure net profit of ~$391M represents only around 12% of total blended 2030 non-GAAP net profit of ~$3.66B — a meaningful contribution, but not large enough to justify a wholesale re-rating away from the cyclical semi peer group. The market is unlikely to assign a 25x+ multiple to a business where the vast majority of earnings still comes from automotive and industrial chips. A re-rating into the low 20s is the realistic ceiling, and at 22x on bull case earnings the implied market cap is approximately $80.5B — roughly 61% above today's $50B market cap, equating to approximately 12.6% annualised over four years. That is a solid return, but it requires both the MRDIMM adoption thesis and the multiple expansion to play out simultaneously. In the base case, at 18x, the implied market cap is ~$63.7B, or 27% above today, equating to roughly 6.1% annualised. The bear case at 14x implies ~$48.2B — modestly below today's price.
What are the comps which you would compare SoFi to for valuation purposes? I ask because its P/E ratio is in between other high growth fintechs such as Robinhood and Nu, while its price to book and PE ratio is significantly higher than banks such as JPM and Wells Fargo. I am new to the industry, so I acknowledge I could be wrong, but at first glance SoFi seems fairly valued at best.
In the linked article I summarize Oscar Health's Q1 2026 earnings and provide a valuation framework for investors.
I added to my $OSCR position at $20.73 after the Company's Q1 2026 earnings, bringing my average cost to $16.30. Oscar is now my largest holding, representing 21% of my portfolio. Here's the short version of why.
Q1 2026 was the best quarter in company history. Revenue up 53% to $4.65 billion. Net income of $679 million — in a single quarter — against a full-year net loss of $443 million in 2025. Medical loss ratio hit a record low of 70.5%. SG&A hit a record low of 15.2%. Management reaffirmed full-year guidance of $18.7–19.0 billion in revenue and $250–450 million in operating profit, a ~$650 million swing from last year's operating loss.
2025 looked terrible because the entire ACA market got far sicker than any insurer had priced for, forcing Oscar to take two large one-time charges — $316 million in Q2 and $275 million in Q4 — that drove reported MLR to 87.4%. That was an industry-wide actuarial shock, not an execution failure. Oscar's response was to raise premiums 28% for 2026 and price in a sicker market from the start. Early data shows morbidity is tracking in-line to favourable versus those assumptions.
The Q1 MLR of 70.5% will rise through the year as deductibles are hit and utilisation ramps — that's normal seasonality. Management guides 82.4–83.4% for the full year. My view is they're being conservative. Applying 2024's seasonal step-up pattern to 2026's Q1 base (shout out @investingwithac for the idea) implies a full-year MLR closer to 79%, well below guidance. CEO Mark Bertolini ran Aetna for eight years with a consistent pattern of setting conservative guidance and beating it. I think that's what's happening here.
At 20x earnings: base case (82.4% MLR) is ~$22, bull case (80% MLR) is ~$34, and my 2027 target remains $70+.
The upside is asymmetric.