We scraped every major finance account on X between February 28 and March 30.
Not one of them called the bottom correctly.
Worse, if you had followed their posts as trade signals, the drawdowns would have been account-threatening.
Large followings do not equal accurate calls. Engagement is not edge. Confidence is not conviction.
The accounts that went quiet during the selloff are the ones worth watching now. The ones that posted the loudest are the ones that cost you the most.
$SPY $QQQ
THE S&P500 INCLUSION EFFECT
We studied every addition to the S&P 500, S&P 400, and S&P 600 since 2016. 303 events. Here's what happens after a stock joins a major index, and why it matters.
THE FINDING:
Stocks added to S&P indices drift higher after inclusion. The effect is statistically significant across all three indices and all post-inclusion windows. It is not significant before inclusion.
S&P 500 (94 events):
Before inclusion (T-5): -0.87%. Not significant. p=0.16.
After inclusion (T+5): +3.13%. Significant. p=0.0004.
After inclusion (T+10): +2.91%. Significant. p=0.01.
After inclusion (T+20): +3.63%. Significant. p=0.01.
S&P 400 (98 events):
Before inclusion (T-5): -0.43%. Not significant. p=0.51.
After inclusion (T+5): +2.66%. Significant. p=0.01.
After inclusion (T+10): +4.70%. Significant. p=0.0007.
After inclusion (T+20): +4.33%. Significant. p=0.006.
S&P 600 (111 events):
Before inclusion (T-5): +0.20%. Not significant. p=0.80.
After inclusion (T+5): +6.23%. Significant. p<0.0001.
After inclusion (T+10): +8.49%. Significant. p<0.0001.
After inclusion (T+20): +6.74%. Significant. p=0.0008.
Every post-inclusion window across all three indices is statistically significant at p<0.01. The pre-inclusion window is not significant in any index. The effect is real. The noise before inclusion is not.
WHY THE EFFECT EXISTS:
Passive funds tracking the S&P 500, 400, and 600 are required to own every constituent. When a stock joins, every tracking fund must buy it. That's forced demand from trillions of dollars in indexed assets. The buying doesn't happen in one day. It takes weeks as international funds, managed accounts, ETFs, and model portfolios adjust. The drift from T+5 through T+20 reflects this staggered rebalancing.
WHY SMALL CAPS SHOW THE LARGEST EFFECT:
S&P 600: +6.23% at T+5, 79% win rate.
S&P 500: +3.13% at T+5, 65% win rate.
The passive buying represents a larger share of daily volume in a $2B small-cap than a $200B large-cap. Same mechanical demand, different liquidity. The S&P 600 effect at T+10 reaches +8.49% with a t-statistic of 5.77. That's one of the strongest effects in market microstructure.
SECTOR MATTERS:
Not all sectors show the same effect. Technology is the strongest in the S&P 500: +6.48% at T+5, 74% win rate, p=0.0008. Double the index average. Energy leads the S&P 600: +10.84% at T+5, 89% win rate. Real Estate is the one sector where the effect is negative in the S&P 500. Sector sample sizes are small in some cases. Technology and Financials are the only sectors with enough observations to be statistically robust independently.
THE PRE-INCLUSION DIP IS NOISE:
The T-5 returns are negative for S&P 500 (-0.87%) and S&P 400 (-0.43%) but neither is statistically significant. The pre-inclusion selling from arb accumulation looks like a dip on any individual chart. Across 303 events, it's indistinguishable from random. The signal is after inclusion, not before.
YEAR-OVER-YEAR STABILITY:
The effect isn't driven by a single year or a few outliers.
S&P 500 at T+5: positive mean in 8 of 11 years (73%).
S&P 400 at T+20: positive mean in 10 of 10 years (100%).
S&P 600 at T+5: positive mean in 10 of 11 years (91%).
The S&P 600 effect produced a positive mean in every single year except 2020, when COVID disrupted everything. The S&P 400 at T+20 has never had a negative mean year in our dataset.
2023-2025 were particularly strong for S&P 500 additions, with win rates of 91%, 67%, and 77% respectively. The growth of passive investing is expanding the effect, not shrinking it.
THE DISPERSION:
These are averages, not guarantees. The standard deviations are significant.
S&P 500 at T+5: mean +3.13%, standard deviation 8.57%. The 95% confidence interval is +1.43% to +4.86%.
S&P 600 at T+20: mean +6.74%, standard deviation 20.87%. Wide dispersion around a strong mean.
35% of S&P 500 additions were negative at T+5. The effect is a probability, not a certainty. Individual outcomes vary widely. The edge is in the aggregate, not any single event.
THE APPLICATION:
This research applies to every future index addition. The framework is mechanical: forced passive buying creates a measurable, statistically significant drift that persists for at least 20 trading days. It is consistent across years and does not appear to be diminishing as the market has become more efficient. The smaller the company, the larger the effect. The tighter the float, the stronger the forced buying impact. The data is not ambiguous.
Tomorrow MRVL and FLEX are set to join the S&P 500. The next SmallCap 600 addition is the one to watch.
$SPY $MRVL $FLEX
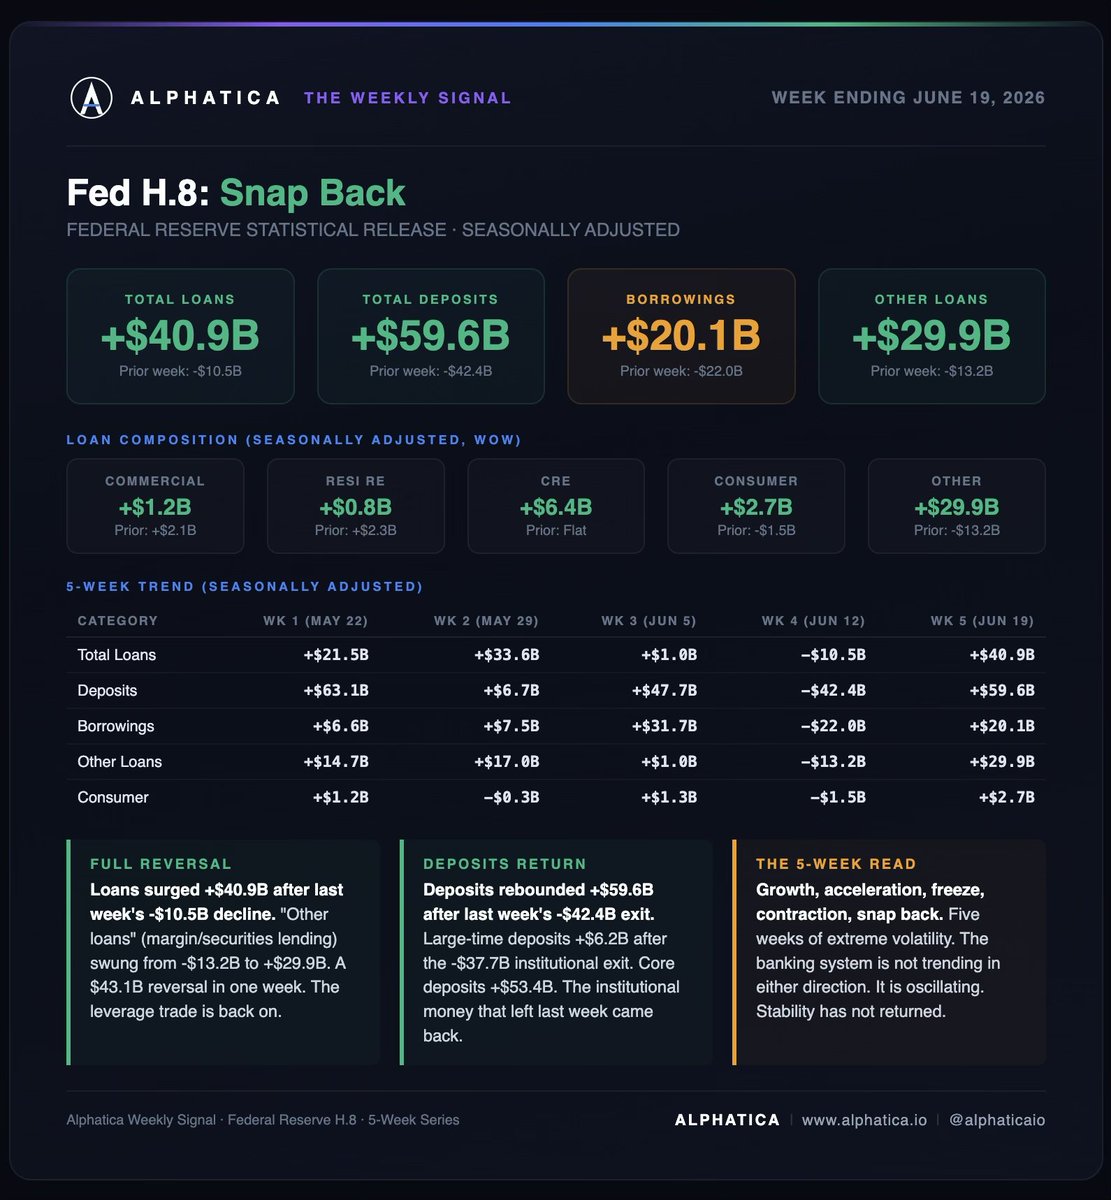
Week 5 of our tracking of the Fed H.8 data. Everything reversed.
Total loans surged +$40.9 billion. Last week they declined $10.5 billion. That is a $51.4 billion swing in one week. Deposits rebounded +$59.6 billion after falling $42.4 billion. "Other loans" swung from -$13.2 billion to +$29.9 billion. A $43.1 billion reversal in margin and securities lending.
The institutional money that fled last week came back. Large-time deposits added +$6.2 billion after last week's $37.7 billion exit. Core deposits rose $53.4 billion.
The 5-week arc:
Week 1: +$21.5B loans, +$63.1B deposits. Growth.
Week 2: +$33.6B loans, +$6.7B deposits. Acceleration.
Week 3: +$1.0B loans, +$47.7B deposits. Freeze.
Week 4: -$10.5B loans, -$42.4B deposits. Contraction.
Week 5: +$40.9B loans, +$59.6B deposits. Snap back.
Five weeks. The banking system went from growth to contraction and back to expansion. This is not a trend in either direction. This is volatility.
The driver behind the snap back: CRE loans added +$6.4 billion, the strongest week in our series. Consumer loans +$2.7 billion. Every loan category turned positive. But the bulk came from "other loans" at +$29.9 billion. The leverage products that collapsed last week are fully restored.
Borrowings rose +$20.1 billion after last week's $22 billion decline. Banks are borrowing again to fund the expanded balance sheets.
What the 5-week data tells you:
The Iran deal removed the geopolitical risk premium. The FOMC gave the market clarity on the rate path. Retail sales confirmed the consumer is still spending. The banking system responded by re-extending credit.
But the oscillation is the signal. The system swung $51 billion in loans and $102 billion in deposits in one week. That level of week-to-week volatility in the banking system is not stability. It is a system searching for equilibrium.
The tightening has not arrived. But neither has the confidence to sustain credit expansion. The data says watch next week.
$SPY $QQQ #FOMC
🚨🚨 DISPERSION UPDATE
Still extreme. Still not compressing.
10 consecutive trading days at HIGH or EXTREME dispersion which is the 2nd longest streak in our dataset going back to 2003. Only one streak was longer (12 days, Feb 2026).
Latest readings:
Jun 1: 97.9th pct: EXTREME
Jun 2: 96.4th pct: EXTREME
Jun 5: 98.4th pct: EXTREME (selloff day, SPY -2.58%)
Jun 8: 81.8th pct: HIGH
Jun 9: 89.5th pct: HIGH
Jun 10: 98.4th pct: EXTREME (selloff day, SPY -1.58%)
Jun 11: 98.5th pct: EXTREME (rally day, SPY +1.70%)
The important detail: Jun 11 hit the 98th percentile on an up day. This isn't selloff-driven dispersion. Stocks are scattering in every direction regardless of whether the index goes up or down.
Forward return data. full 23-year dataset with 5,607 trading days:
EXTREME dispersion (95th+ pct) · 343 days:
→ SPY avg 20d: +1.08% · avg 60d: +3.97%
→ QQQ avg 20d: +2.40% · avg 60d: +8.50%
→ IWM avg 20d: +1.25% · avg 60d: +5.41%
HIGH dispersion (75th–95th pct) · 702 days:
→ SPY avg 20d: +0.63% · avg 60d: +1.79%
→ QQQ avg 20d: +0.72% · avg 60d: +2.57%
→ IWM avg 20d: +0.63% · avg 60d: +2.23%
NORMAL & LOW (<75th pct) · 4,562 days:
→ SPY avg 20d: +0.77% · avg 60d: +2.28%
→ QQQ avg 20d: +1.14% · avg 60d: +3.39%
→ IWM avg 20d: +0.49% · avg 60d: +1.27%
The structure hasn't changed. HIGH is still the worst forward return environment. EXTREME still resolves forward.
$SPY $QQQ $IWM
DARK POOL SCANNER | June 17, 2026
Hawkish Warsh. Lit: -$10.32B. Dark: -$1.13B. The dark pool still buys $SPY. $MSFT -$629M zero DP buys. Both tapes agree: sell $QQQ. Buy $MU.
478 off-exchange prints ≥$5M. Hawkish Warsh. VWAP hit 18.3%. The lowest of the series. And the dark pool still bought $SPY.
Dark Pool Buyers:
$MU +$717M (25 prints, BOTH AGREE)
$SPY +$358M (100 prints, LIT: SELL -$5.66B)
$AMD +$263M (12 prints, BOTH AGREE)
$RTX +$107M (5 prints, DEFENSE)
Dark Pool Sellers:
$IWM -$927M (44 prints, BOTH AGREE)
$QQQ -$663M (72 prints, BOTH AGREE)
$MSFT -$629M (12 prints, $0 DP BUYS, BOTH AGREE)
$GLD -$29M (11 prints, NEARLY FLAT, ACCUMULATION PAUSED)
The dark pool still buys $SPY. The lit tape sold $SPY -$5.66B. The dark pool bought +$358M. On a hawkish Fed day. With VWAP at 18.3%. With breadth at 0.58x. The lit tape panicked. The dark pool accumulated. The pattern holds through a regime change.
The $SPY/$QQQ split continues. Third consecutive session. The dark pool buys $SPY and sells $QQQ. Both tapes agree on $QQQ sell (-$3.22B lit, -$663M dark). Only the dark pool buys $SPY. The rotation between broad market and tech-heavy is structural.
$MSFT: -$629M with zero dark pool buys. -$1.70B on the lit tape with $38M buys. Both tapes agree. The distribution returned with full force on FOMC day. The two sessions of buying last week are over.
The semi split exists on both venues. Dark pool: $MU +$717M, $AMD +$263M. Both agree buy. Lit tape: $NVDA -$1.86B. The dark pool picked the same semi names as the lit tape's buy side ($MU, $AMD) and avoided the same names the lit tape sold ($NVDA). Cross-venue agreement on which semis to own.
$RTX: +$107M. Defense on the dark pool buy side for the second consecutive session. The hawkish rate trade benefits defense spending.
$GLD: -$29M. Nearly flat. The four-session gold accumulation paused on hawkish Warsh day. The dark pool built +$850M in gold over four sessions. Today it paused. Not sold. Not reversed. Paused. The position sits.
Today the framework documented:
11:53 AM: Morning internals. Breadth 1.91x. The expectation.
12:15 PM: Intraday dark pool special. -$2.83B. The positioning.
2:00 PM: Warsh was hawkish. The decision.
2:20 PM: $107M $GLD buy crossed. The reaction.
3:23 PM: $SPY buys, $QQQ sells. The playbook.
3:28 PM: VWAP 18.3%. The aftermath.
4:00 PM: Final tape. -$10.32B lit. -$1.13B dark. The receipt.
Seven posts. One session. One decision. Everything documented in real time.
OPEX tomorrow. Week fifteen. The framework holds.
Now you're watching both.
🚨🚨🚨Dark pool alert. 11:54 AM. (it's a big one)
| 11:54:14 QQQ SELL $998,969,396 NASDAQ Carte |
$999M $QQQ sell just crossed off-exchange. Nearly $1B in a single print. Two hours before Warsh speaks.
Yesterday our dark pool scanner showed both tapes agreeing on $QQQ sell: -$4.08B lit, -$970M dark. Today another $1B sell print into the decision.
The broad market breadth is 1.91x. $XBI is surging +4.6%. The market is positioning for dovish. But someone just sold $1B in $QQQ in the dark two hours before the headline.
Breadth says advance. The dark pool says hedge the Nasdaq. We document both. Warsh at 2 PM.
$QQQ $SPY #FOMC
Posting again for reach. The below dark pool whale print was probably a strong signal to expect some type of short term resolution.
DARK POOL ALERT:
11:54:14 QQQ SELL $998,969,396 NASDAQ Carte
$QQQ $SPY
WEEKLY DARK POOL RECAP | June 8-12, 2026
"You can't classify direction in dark pools."
We heard it (many times). Here are the receipts.
Our direction classification algorithm produced 9 individual name signals this week across 1,809 off-exchange prints ≥$5M. We measured every signal against the actual return for the week ending June 12.
Signal accuracy: 7 out of 9 correct direction (78%).
Sell signal accuracy: 3 out of 3 (100%).
Buy signal accuracy: 4 out of 6 (67%).
ALPHATICA BUY SIGNALS vs ACTUAL RETURNS
$INTC Signal: BUY Net: +$518M Return: +25.6% ✓
$MU Signal: BUY Net: +$230M Return: +13.6% ✓
$TSLA Signal: BUY Net: +$213M Return: +3.9% ✓
$NVDA Signal: BUY Net: +$712M Return: +0.04% ✓
$GLD Signal: BUY Net: +$634M Return: -2.4% ✗
$AAPL Signal: BUY Net: +$525M Return: -5.3% ✗
$INTC: our algorithm classified +$518M in cumulative dark pool flow as institutional buying. The stock returned +25.6%. By Friday, $INTC had +$743M in dark pool buys with zero sells and +$1.97B on the lit tape with $8M in sells. Both venues. Zero opposition. The algorithm identified the accumulation. The return confirmed it.
$AAPL: our algorithm classified +$525M as institutional buying. The stock declined -5.3%. The signal missed. We show it. The reason for the selloff WWDC. We expect $AAPL to move higher from here.
$GLD: +$634M classified as buying. A new position being built across two sessions. Gold declined -2.4%. Whether the dark pool was early or wrong is a question for this upcoming week.
ALPHATICA SELL SIGNALS vs ACTUAL RETURNS
$META Signal: SELL Net: -$700M Return: -4.4% ✓
$GOOGL Signal: SELL Net: -$424M Return: -2.4% ✓
$NFLX Signal: SELL Net: -$250M Return: -2.2% ✓
3 out of 3. Every name our algorithm classified as institutional selling declined. $META: -$700M across three appearances, all classified as sell. Down -4.4%. $GOOGL: -$424M, mostly sell. Down -2.4%. $NFLX: -$250M in a single session with zero dark pool buys. Down -2.2%.
The sell signals were perfect. When the algorithm flags persistent selling with zero or near-zero buyer interest, the name declined every time this week.
INDEX SIGNALS: STRUCTURAL HEDGING
$SPY Signal: HEDGE Net: -$2.76B Return: +0.57%
$QQQ Signal: HEDGE Net: -$1.47B Return: +2.31%
$IWM Signal: HEDGE Net: -$2.36B Return: +4.01%
The algorithm detected institutional hedging at the index level. The dark pool sold all three indexes for the week while all three rose. This is not a miss. This is risk management. The institutions bought individual names ($INTC +25.6%, $MU +13.6%) and hedged broad market exposure off-exchange. The index selling funds the individual name buying. Different function. Different interpretation.
WEEKLY SCORECARD
Signal accuracy: 7/9 (78%)
Sell signals: 3/3 (100%)
Buy signals: 4/6 (67%)
Biggest hit: $INTC +25.6% on buy signal
Biggest miss: $AAPL -5.3% on buy signal
We publish every signal in real time. We validate every signal against the actual return. We show the $INTC hit and the $AAPL miss. We show the $META sell that worked and the $GLD buy that didn't.
"You can't classify direction in dark pools." 78% says otherwise. 100% on sells says otherwise. The receipts are on the timeline. Every day. Every week.
The algorithm works. The tape doesn't have an opinion. It has a receipt.
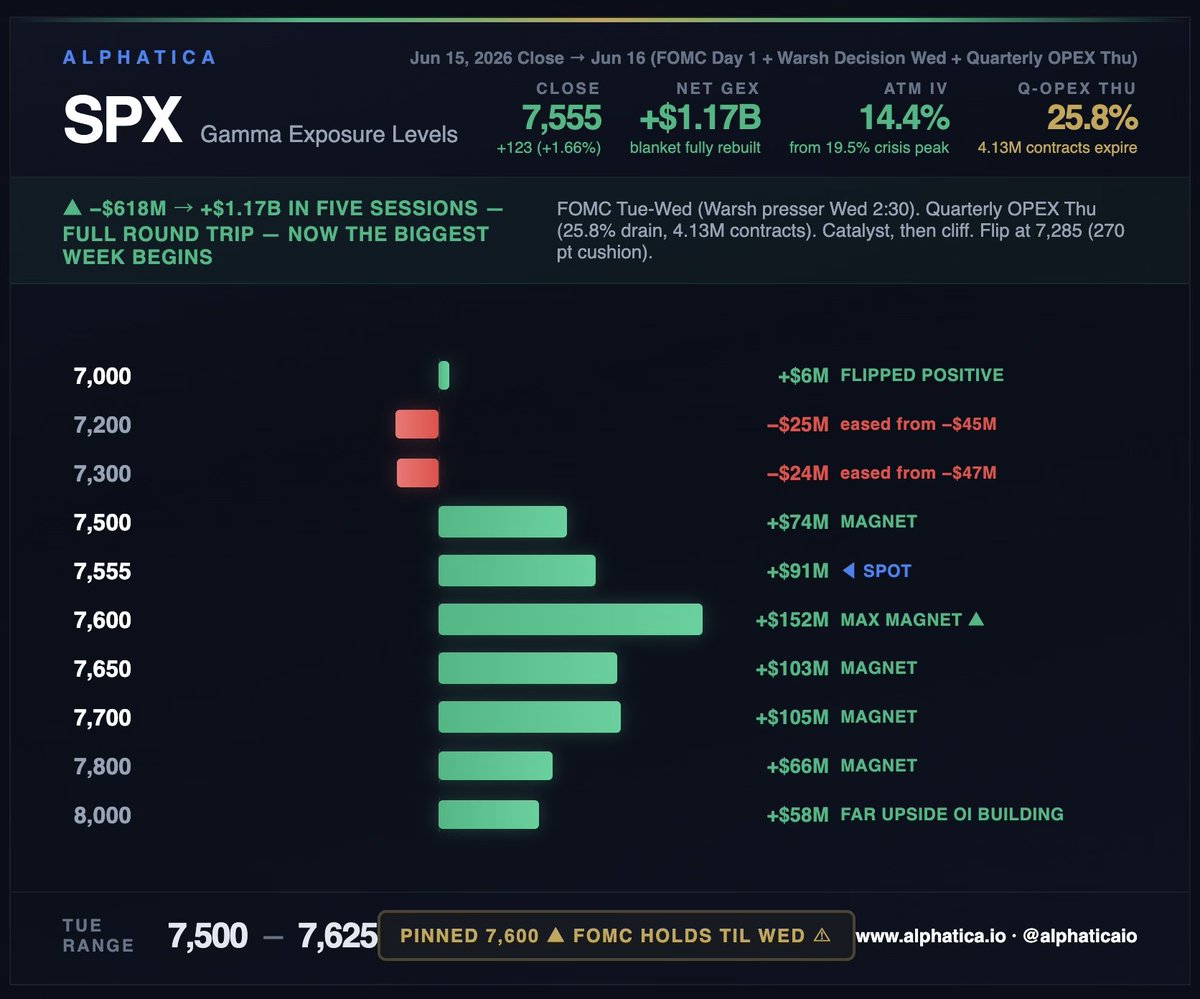
SPX GEX LEVELS: Jun 16 (FOMC Day 1)
The blanket is back. Net GEX rebuilt to +$1.17B, the first reading above $1B since June 3, before AVGO (earnings) broke the structure.
Five sessions ago our scanner read -$618M. Today it reads +$1.17B. A $1.79B round trip. The deepest negative gamma in the series followed by the fastest recovery in the series. The institutions rebuilt the entire structure in the same number of sessions it took to destroy it. The cycle from crisis to recovery is now complete.
The 7,000 strike flipped positive for the first time since the AVGO selloff. It reads +$6M, thin, but the polarity changed. The accelerators at 7,200 and 7,300 eased from -$45M/-$47M to -$25M/-$24M. Still negative, still present, but losing force as puts decay and the crisis positions unwind. The accelerator infrastructure that drove the negative gamma week is deflating, not holding.
ATM IV compressed to 14.4% from the 19.5% crisis peak, nearly back to the 13-14% suppression regime. The vol round trip from 13.2% (pre-AVGO) to 19.5% (crisis) to 14.4% (today) mirrors the GEX round trip. The market priced fear, absorbed it, and un-priced it.
The magnets above are the strongest since late May. The 7,600 max magnet at +$152M is 45 points above. 7,650 at +$103M. 7,700 at +$105M. 7,800 at +$66M. A $426M wall of magnets from 7,600 to 7,800. The COG sits at 7,674, pulling 1.6% above spot. The magnet migration pattern that drove the rally from 7,200 to 7,600 has re-engaged.
The flip sits at 7,285, 270 points below. The deepest cushion since the AVGO selloff. The regime is unambiguously positive.
Now the week that matters.
FOMC meets tomorrow and Wednesday. No decision expected today, the market holds its breath until Wednesday at 2 PM. Warsh's first press conference follows at 2:30. The market will position into the statement cautiously and then reprice on Warsh's language. At +$1.17B, the gamma blanket compresses any pre-decision positioning into tight ranges. The blanket doesn't tell you what Warsh will say. It tells you the market will wait patiently to hear it.
Thursday: Quarterly OPEX. 25.8% of remaining gamma. 4.13 million contracts. The largest single expiration since March. This is the cliff after the catalyst. Wednesday afternoon the market reprices on Warsh. Thursday morning 25.8% of the cushion expires. After Thursday, the blanket that just rebuilt to $1.17B loses roughly a quarter of its mass in a single session.
The sequencing is the risk. If Warsh delivers dovish or neutral and the market rallies into OPEX, the Thursday drain strips gamma from a structure sitting at highs, the same setup that preceded the May OPEX cliff. If Warsh surprises hawkish and the market sells into OPEX, the drain strips gamma from a falling structure, the setup that created the negative gamma crisis. The OPEX drain is agnostic. It hits regardless.
Call buying today tells the story: 7,600 absorbed +$132M of new call volume, the heaviest single-strike flow of the session. 7,575 at +$53M. 7,700 at +$31M. Institutions are positioning for the 7,600 level into the Fed. But put buying hasn't stopped: volume P/C hit 1.54. They're buying calls and hedging simultaneously. That's the signature of a market that believes in the direction but respects the event risk.
Tomorrow's expected range: 7,500 – 7,625. The blanket at +$1.17B compresses. The 7,600 magnet pulls. FOMC day 1 is positioning, not pricing. The action is Wednesday.
Structural floor: 7,285 (-3.6%).
solana:J3NKxxXZcnNiMjKw9hYb2K4LUxgwB6t1FtPtQVsv3KFr $SPY $QQQ
DARK POOL SCANNER | June 15, 2026
Lit: +$15.20B. Dark: -$3.94B. The structural hedge returns. $GLD +$113M. Third session. Gold +3.4% today. The dark pool was right.
459 off-exchange prints ≥$5M. The lit tape bought +$15.20B. The dark pool sold -$3.94B. Friday both tapes agreed. Today they disagree again.
Dark Pool Buyers:
$MU +$389M (37 prints, BOTH AGREE)
$MSFT +$248M (16 prints, ZERO DP SELLS, BOTH AGREE)
$AVGO +$212M (7 prints)
$AMD +$178M (10 prints, BOTH AGREE)
$GLD +$113M (15 prints, 3RD SESSION)
Dark Pool Sellers:
$QQQ -$3.11B (69 prints, LIT: BUY +$1.51B)
$SPY -$2.57B (79 prints, LIT: BUY +$2.02B)
$IWM -$186M (19 prints)
Friday: both tapes agreed. The structural hedge paused. Today: back.
The dark pool sold $QQQ -$3.11B, $SPY -$2.57B, $IWM -$186M. Combined -$5.87B in index selling off-exchange. The lit tape bought all three indexes. The divergence returned after one session of consensus. The structure is persistent.
$GLD: +$113M. Third consecutive session of gold accumulation in the dark pool. The running total: +$121M (June 9), +$513M (June 11), +$113M (June 15). Combined: +$747M.
On June 10 gold crashed -4.7%. The dark pool had already started buying the day before. On June 10 the dark pool continued accumulating while the surface sold. Today gold surged +3.4%. The dark pool was right. The position they built over three sessions while the surface panicked about CPI and rate hikes is now paying.
$MSFT: +$248M with zero dark pool sells. Both tapes agree on $MSFT buy for the second consecutive session. The flip from Friday held through the weekend and into the new week. The longest distribution pattern of the series is over.
$MU: +$389M in the dark pool. +$4.91B on the lit tape. Both tapes agree. Micron is being accumulated at scale on both venues.
$AMD: +$178M. Both tapes agree. Another semi name with cross-venue consensus.
$AVGO: +$212M. Broadcom accumulated in the dark pool.
The dark pool buys the names it wants. Hedges the indexes it doesn't control. The semi complex, $MSFT, and gold are being accumulated. The indexes are being sold. Same structure. Same pattern. Same framework.
FOMC Tuesday-Wednesday. First Warsh decision. The dark pool is positioned. Week fifteen.
Now you're watching both.
U.S-IRAN CEASEFIRE DEAL BREAKDOWN
NUCLEAR
✅ Iran commits to never acquire a nuclear weapon
✅ Iran be open to down-blending their highly enriched uranium inside Iran under supervision of UN inspectors.
✅ Steps on Iran's nuclear program would only take place if a second deal on the second stage is reached
STRAIT OF HORMUZ
✅ U.S to remove their blockade
✅ Strait opened without tolls
✅ Pre-war shipping within 30 days
LEBANON
✅ Ceasefire in whole Middle East including Lebanon
SANCTIONS
✅ Sanctions on oil lifted for 60 days
✅ Sanction relief would increase if Iran complies with the initial agreement and shows "good faith" in subsequent negotiations.
FROZEN ASSETS
✅ Iran want some sanctioned money upon signing any initial deal
✅ U.S. has said it would be released in tranches
CEASEFIRE DETAILS
✅ 60 Day Ceasefire
✅ Ceasefire mediated by Qatar and Pakistan
✅ JD Vance signing ceremony in Geneva
✅ Called ‘Islamabad Agreement’
Source: Axios
For the record, Iran did not shoot down the helicopter, and Trump is lying, but the Islamic Republic is more than prepared to teach the Epstein Coalition a lesson.