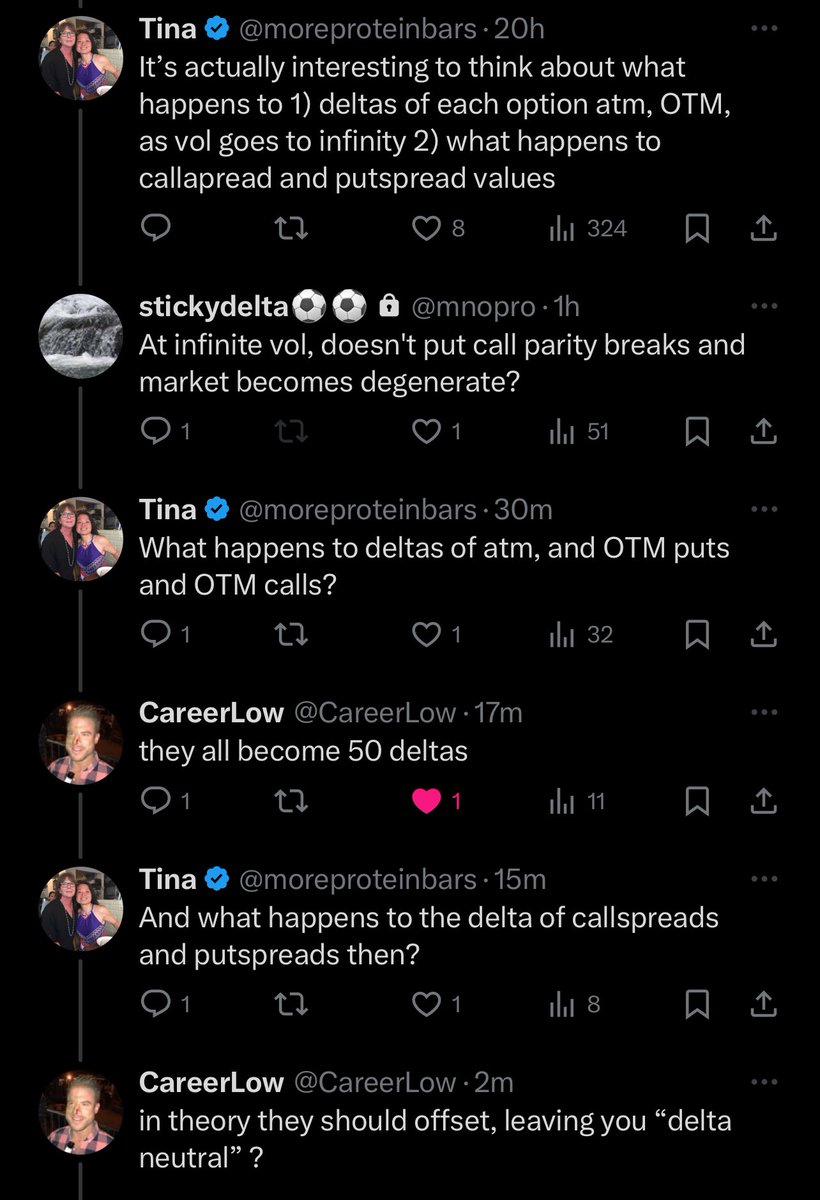
The dispersion trade: What is it and why should you care? A 🧵
Per Goldman:
"Over the last 5 trading sessions, the realized volatility for the SPX index is ~15 (0.9% daily move)
Over the last 5 trading sessions, the realized vol for the avg SPX stock is ~45 (2.8% daily move)
This 30 vol spread is the highest since November 2020 (election + vaccine efficacy data) ... this 30 vol spread is in the top 10 going back 25 years (GFC, covid, etc inclusive)"
The CIOs and senior portfolio managers are on here because we like teaching and educating and we have already had our successes, its a completely absurd free resource if you know how to use it
As @nope_its_lily mentioned:
Be young and smart and cocky and think you know a lot of stuff
Path 1: ask a lot of questions, be open minded and nice, find that extremely senior people on here will mentor you, become CIO of a not-tiny risk taking institution at a crazy young age
Okay the people asked for a trade sizing discussion. I'll mostly stick to giving my perspective as an institutional derivatives manager, which is different from the thought process of an individual trader but hopefully interesting.
Market Making Illiquid, Non-Fungible Assets (S7E14)
Today I’m talking to Thao Tran (@tpvt136), Co-founding Partner at Vamient Capital.
This episode was born from a question I had watching the NFT market place: how do you make markets in illiquid, non-fungible assets? Clearly people were doing it and I wanted to know how it differed from traditional market making.
Several people recommended I speak with Thao, and she was kind enough to oblige, despite NFT market making being just a small component of what she does. In this conversation, we walks me through how the NFT market place has evolved, how she thinks about managing inventory risk, key features that impact spreads, and how platform evolutions changed orderbook strategies.
In the back half of the conversation, Thao shares her thoughts on the state of crypto markets today, the emerging opportunities in decentralized exchanges, and how the landscape of alpha opportunities has changed over the last two years.
I hope you enjoy my conversation with Thao Tran.
The December Risk Update is up at the Convex Strategies website - "Deja Vu". We've been drawn back again to our memories of the unique 1995-1999 period. Signs of a shake-up to existing global systems just keep arising. Enjoy.
https://t.co/pgNWmOO919
They scream about everything the Fed does. Everything is a policy mistake, behind the curve, moving too fast, whatever. Central Banks responsible for them not getting laid. They are deeply ignorant people.
"The Fed caused all this post-COVID inflation"
remember when clowns were screaming about QE in 2008, buying inflation swaps and shorting the 10y treasury all the way to 4.5% yield, got liquidated en masse because inflation stayed below 2% for 15 years
> President of the United States drops a meme coin on Friday night. Retweet's his wife's meme coin next day
> ahead of inauguration where he has 4 more years
> "guys this is the last bullish news we will get"
> sells everything
crazy that didn't work out
I also spoke about this on the podcast with @ttmygh . PB net leverage exposure continues to grow, not only across firms like IB, but across the entire street.
This is a key positional function that drives the bid for volatility during spot declines. Aka volatility’s outperformance.
ETFs are not always better than mutual funds.
The ability to guarantee NAV for entry/exit and the ability to close the fund means you can trade less liquid/harder to hedge stuff.
And if the strategy wasn't going to be tax efficient in an ETF in the first place...
oh takeaways...
1) i love my friends in derivatives sales, but hedge funds run by ex derivatives salespeople = red flag
2) you cannot risk manage a derivatives portfolio to Greeks ("I'm flat vega, it's fine!") or historical VaR ("this doesn't lose money most of the time!")
The market is searching for a short-term bottom, says @jam_croissant. When will it find one?
🥐 Cem Karsan joins @OJRenick LIVE to share his latest market 𝗰𝗿𝘂𝗺𝗯𝘀: https://t.co/VhlWGjStdr
- Everybody looks at the price action and then comes up with an answer for 'why', but the truth of the matter is ... 👇
Check out today’s @CNBC appearance with @RickSantelli on @PowerLunch, live from the @CBOE floor. Link below to watch!
Okay I promised I'd write more about this, here it is.
Dividend swaps and futures are a deceptively simple product that give the owner an exposure to the amount of dividends paid by a stock or an index over a specified time period. They exist because of structured products.
The Jan 13 gap fill forecast was spectacular, especially for those focused on "what will the market do next"
Now do yourself a huge favor that will last at least a year or two. In this podcast @jam_croissant covers in depth:
1/the recent jump in short term VIX due to the SPX drop that makes a rebound for couple weeks-couple of months due to vanna and charm highly likely
2/the likelihood that the period between Feb and Mar Opex a real danger zone for the beginning of a sustained stair step drop reminiscent of 1972-1980 for many of the same reasons including populism and interest rates
3/After 40 years of steadily falling long term interest rates the tide has turned and many large holders/buyers are caught offside with portfolios that will continue to decay with no opportunity to "buy a substantial dip" The Pain Trade will become horrific. The end result of fixed income institutions not massively hedging while the hedging was cheap.
4/Inflation with higher prices will help revenues for equities but profit margins will take a beating while at the same time rising long term bond rates will push equity PEs lower and lower.
5/Vol in the near term is still reasonably well supplied, but ever since the sharp August SPX drop when near term vol fell back to very low levels, in contrast vol for 6-8-12 months far out on the bearish low delta wing has stayed high leading to high put skew and has stuck there as it is not being supplied. A sustained even relatively sharp market pullback could push those elevated vol levels at low delta even higher because it would be a dangerous place to sell vol into.
6/This could be a strong convexity trade, as could the situation in bonds described above. In both cases those looking for protection or "relief" could be forced to pay an excruciating price for it.
7/China situation could be currently being read quite wrong. It is not 2016. Since then China and Russia have closely united. So a Russia=Friend China=Enemy strategy will not work. Add to that @elonmusk need for strong China Tesla market and Elon's strong influence on Trump and "detente" with China could propel heavily discounted Chinese equities into prominence. Not a sure bet but a very interesting lottery ticket
Best way to digest this extremely important long explanation by Cem is to open it in the Apple Podcast app and then choose the "Transcript" Extraordinarily valuable. You will long remember it. the Mother of All Macro Outlooks (with some critical option flow / positioning information thrown in)
How is the ConnorRSI performing Out-of-Sample?
In 2014, Larry Connors and his team introduced the Connors RSI (CRSI), a technical oscillator designed to identify short-term mean-reversion opportunities in U.S. stock markets.
Unlike the traditional Relative Strength Index (RSI), which measures price momentum over a 14-day period, CRSI combines three components to enhance its sensitivity to short-term price movements:
1. Relative Strength Index (RSI): A 3-period RSI that gauges recent price momentum.
2. Up/Down Streak Length: This measures the number of consecutive days a stock has closed higher or lower. A 2-period RSI is then applied to this streak value to quantify its strength.
3. Relative Magniture of Price Change: This assesses the magnitude of price change over a specified look-back period, typically 100 days, by ranking the most recent price change against those within the look-back period.
The CRSI value is calculated by averaging these three components, resulting in a number between 0 and 100.
Traders interpret CRSI values below 10 as indicating oversold conditions, suggesting potential buying opportunities, while values above 90 indicate overbought conditions, signaling potential selling opportunities.
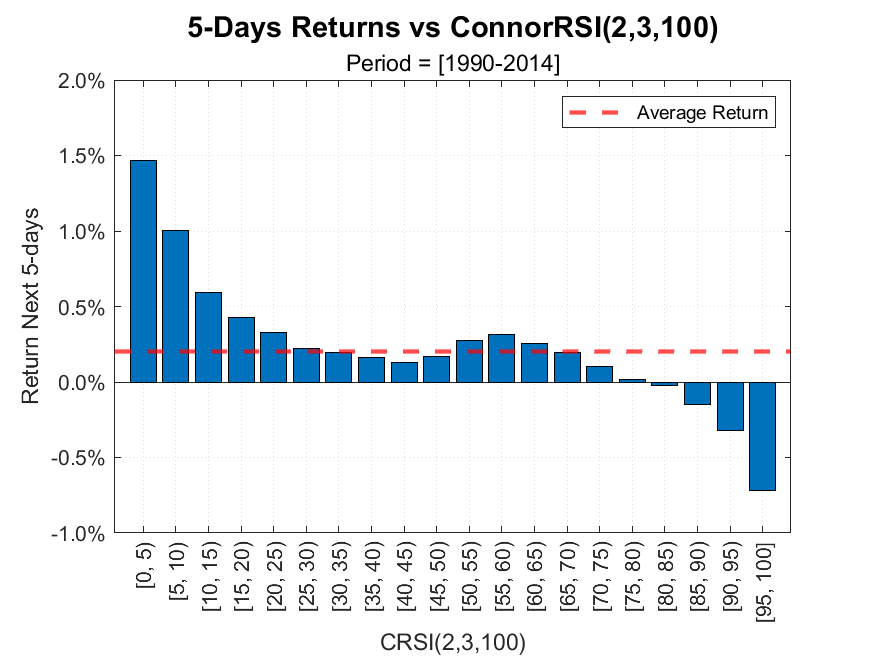
An empirical analysis conducted by Connors on the U.S. stock market from 1990 to 2014 demonstrated the oscillator's predictive power. Specifically, as exhibited in the chart below, when the CRSI was below 10, the average return over the next week was approximately 1.25%. Conversely, for CRSI levels above 90, the expected one-week return was negative at -0.50%.
To assess whether CRSI maintains its efficacy in identifying short-term reversals a decade after its introduction, we extended the empirical backtest using U.S. stock data from @NorgateData, covering the period from 1990 to 2025.
We applied liquidity filters to exclude less-traded stocks, considering only those priced above $5 with an average daily volume exceeding 500,000 shares. These criteria align with the original backtest parameters used by Connors in his book "An Introduction to Connors RSI".
To visualize the time-varying predictive power of the indicator, we created an animation plotting the average 5-day returns for different CRSI values over rolling 10-year periods, starting from 1990-2000 up to 2015-2025.
The animation reveals a noticeable decline in the indicator's effectiveness over time. For instance, during 1990-2000, stocks with a CRSI below 5 yielded an average return of 1.5% over the next week. In contrast, in the 2015-2025 period, the same CRSI levels corresponded to a more modest 0.3% return. On the overbought side, in the 1990s, stocks with a CRSI above 95 experienced an average one-week return of -0.7%, whereas in the last decade, the return was approximately -0.5%.
Despite the diminished edge, CRSI still exhibits some capacity to identify short-term long and short opportunities in U.S. markets. The reduced effectiveness may be attributed to market evolution, increased algorithmic trading and broader adoption of the strategy.
Enhancing the indicator's performance could involve incorporating more sophisticated entry and exit criteria, along with advanced position sizing and ranking methodologies.
Future investigations may delve deeper into these aspects to refine the strategy. In the meantime, we welcome any suggestions or insights you may have.