October isn't over yet and we've already shipped a LOT at ChartMogul! 🚀
Here's what's new:
📊 AI-generated charts & visualizations – Describe what you want to see, and ChartMogul AI creates it. Sankey diagrams, heatmaps, scatter plots, donut charts, and plenty more. Go way beyond our built-in reports!
🔍 https://t.co/0M3S1NGT4f – Ever wondered why your MRR in Stripe doesn't match ChartMogul? We built a free tool that compares the numbers customer by customer and explains what's causing the differences.
👥 Contact Lists, Profiles & batch actions – Segment contacts using customer and subscription data, explore detailed contact profiles, and send personalized emails or enroll multiple contacts in sequences. All directly from ChartMogul.
📎 File uploads in ChartMogul AI – Upload spreadsheets, CSVs, PDFs, images, and other files. Analyze them alongside your subscription data, ask questions, create visualizations, and export the results.
📱 A completely redesigned iPhone app – Rebuilt around ChartMogul AI. Ask questions about your metrics, customers, and business performance, wherever you are.
⏸️ More control over paused subscriptions – Choose whether pausing a subscription leaves MRR unchanged, reduces it to $0, or records churn. Available for Chargebee, Recurly, and custom/API sources, with Stripe support coming soon.
And there's still another week of October to go! 🎃
Huge thanks to the team for making all of this happen. 🙌
🔗 https://t.co/m6AYSkaFK8
📱 https://t.co/iOTDBN7iXE
Your MRR in Stripe doesn’t match @ChartMogul. What gives?
Two hours, twelve tabs, and a spreadsheet later, you’re still not sure.
Meet MRRaudit: see exactly which customers, invoices, and billing rules explain the gap.
https://t.co/JIJDqSKqKE
🚀 Your customer data just got a lot more actionable!
We just shipped:
📋 Contact Lists with powerful filters
👤 Contact Profiles
✉️ Batch email & sequence enrollment
🤖 Automated outreach with workflows
All connected to your subscription and revenue data.
https://t.co/BvpJ3WtII4
As everyone is doing it, here's mine 👇 asked Opus 5.5 to turn our website into a short explainer video of what CharMogul is all about. Incredible output for a 8 minute 1-shot attempt
Two very useful ChartMogul features just went live 🚀
1) Find and batch merge duplicate customers
We now have a dedicated admin tool for finding duplicate customer records across your entire account.
The UX is a bit like a virus scanner:
🔎 Set your matching criteria
▶️ Start a scan
📋 Review matches as they appear
✅ Merge them one-by-one or in bulk
This is especially useful when customer data is flowing in from multiple places – Stripe, HubSpot, Segment, APIs, and so on.
You could already use automations to merge customers as they’re created or updated, but identifying existing duplicates across your full customer base wasn’t as easy as we wanted.
Now you can clean things up properly and get your data in much better shape for accurate reporting and AI-led analysis.
2) New automation action: Enroll in sequence
You can now automatically enroll contacts in a sequence when something happens.
For example:
→ Starts a trial
→ Schedules a cancellation
→ Purchases a monthly plan
→ Moves into a particular segment
→ Meets any other automation criteria you define
Both features remove a lot of manual work and make ChartMogul a much better place to operate directly from your customer data.
We just overhauled Settings in ChartMogul.
Settings now has its own home dashboard – because apparently we really do love dashboards – giving admins a much clearer view of their workspace and setup.
We also added a new Getting Started page and made dozens of smaller improvements throughout Settings.
A few examples:
– Organize Segments and Email Templates into folders
– Bulk delete them
– Generally find and manage things much more easily
Lots of small improvements that add up to a much better admin experience.
Check it out 👇
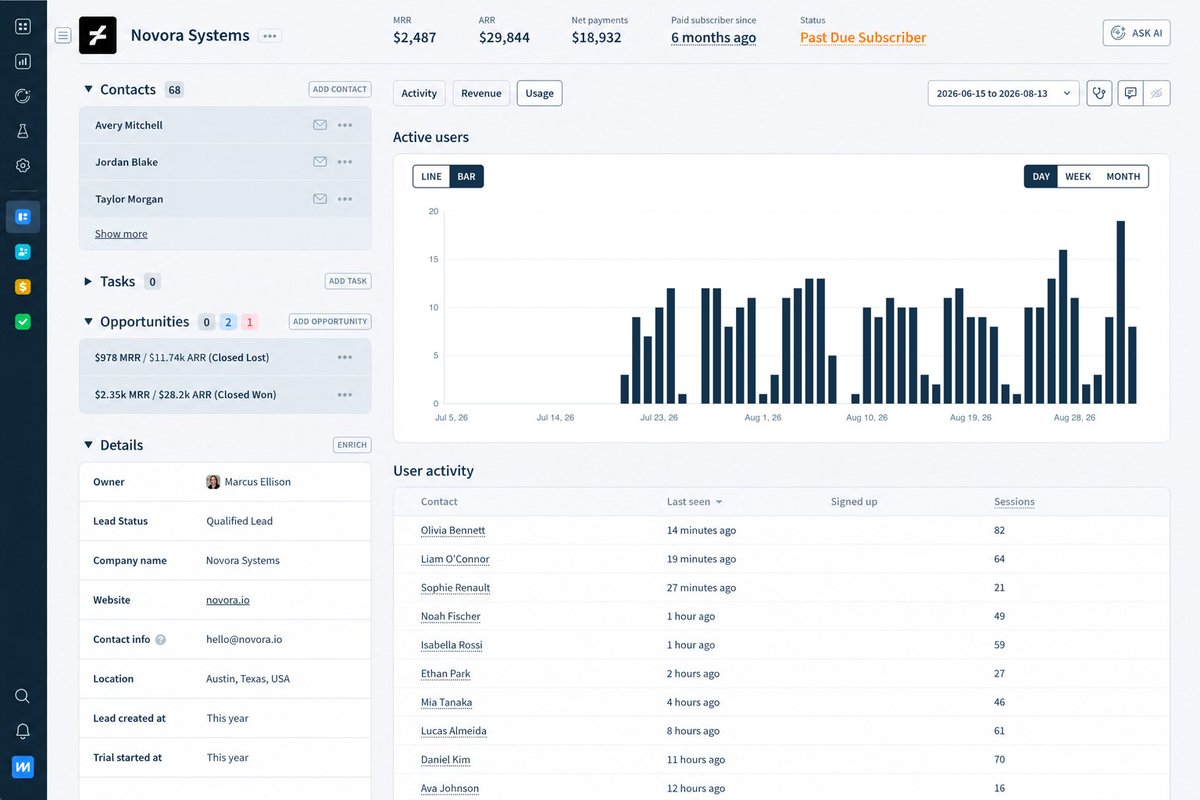
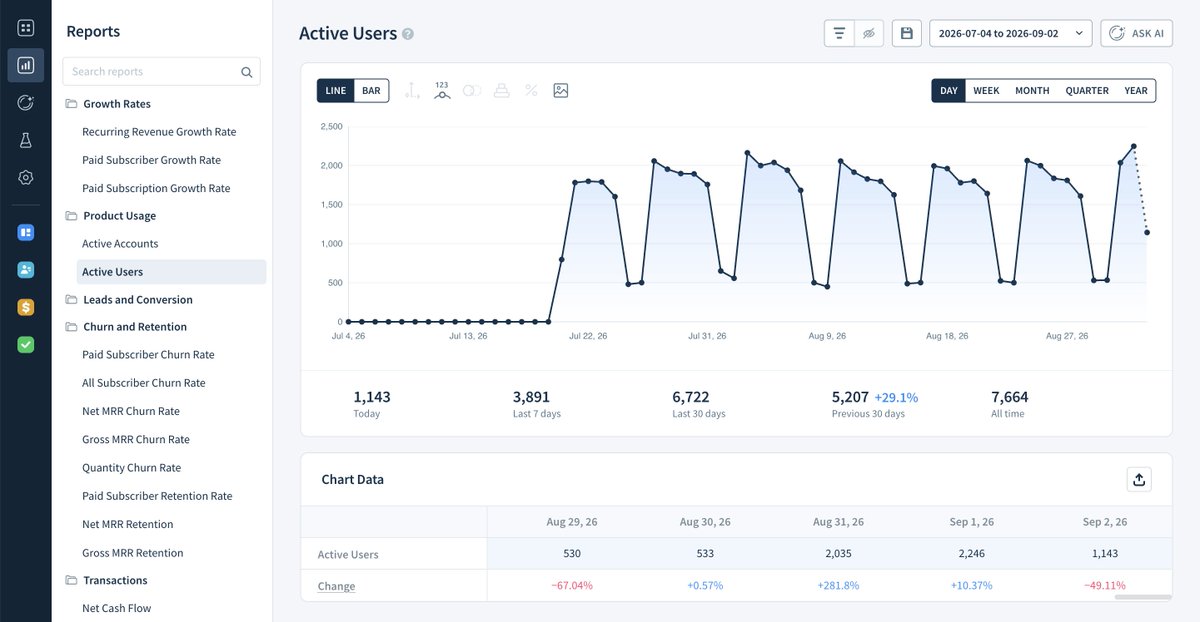
We just launched ChartMogul.js
Drop a small JS snippet into your app and ChartMogul can now see who is actually using your product – and how often.
It gives you:
1️⃣ Usage history directly on customer profiles
2️⃣ Active Users and Active Accounts charts
3️⃣ Usage data you can segment and filter alongside the rest of your customer data
4️⃣ Better ChartMogul AI answers by combining product usage + revenue + CRM data
But the more interesting part is where this is going.
We want ChartMogul.js to become a lightweight connection between ChartMogul and your product itself.
That means things like:
🗺️ Visualizing your users on a map, with marker clustering
📣 Sending 1:many in-app announcements (think feature announcements)
💬 Sending 1:1 in-app messages
🔁 Using in-app messages inside sequences alongside email
🚪 Eventually powering cancellation flows and other in-product experiences
For now, it starts with usage tracking. But having this connection into your app will let us build a lot on top of it.
I love this new ChartMogul feature because the AI just fades into the background.
A bit like searching for “dogs” in Apple Photos – it’s just there when you need it.
Check out this video to see what I mean 👇
LTV is usually BS but sometimes not BS. When?
An article principally written and researched by @tanastaselos at @ChartMogul, co-authored by yours truly, a long-time skeptic of LTV.
But now with 35k data points to back it up!
https://t.co/nene3HPlft
We spoke with Buffer's growth guy Simon Heaton to get the scoop on what was really behind Buffer’s return to sustainable growth, well worth the read 👇
https://t.co/SsMU70JnB4
I'm loving the new artwork our team created for our new website.
Doing away with our product pages and instead building these four "Made for" pages has made our positioning sharper than it's ever been 💎
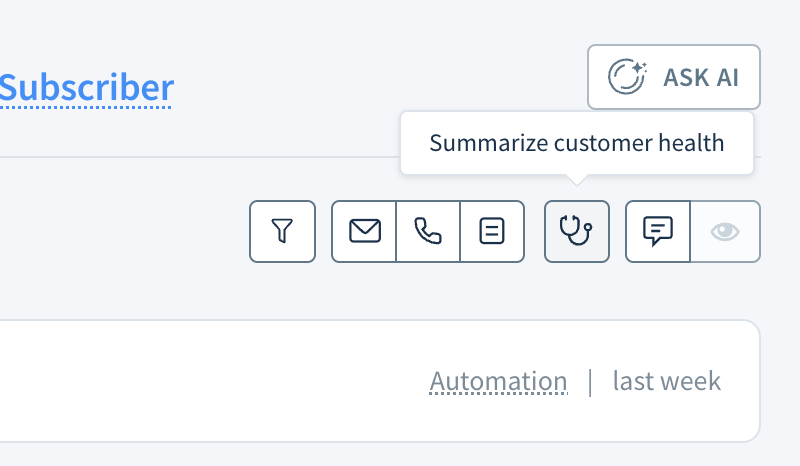
If you use ChartMogul I recommend clicking the new "Summarize customer health" button 🩺 you'll find on all your customer profiles.
Be sure to connect your mailbox to ChartMogul first, the results are much better when customer conversations are available to the AI.
ChartMogul AI is live.
Metrics show you what happened. Figuring out why usually means hours of digging.
Now you can just ask:
• How much should we actually spend acquiring customers?
• What were the real reasons people cancelled last quarter?
• Write last month’s investor update.
It pulls revenue, usage, benchmarks, and CRM context together so you get answers instead of more charts to stare at.
We also made CRM free for every user. No more paid seats.
This is the shift: less dashboard you check, more system that helps you understand (and act on) your business data.
🎥 More info: https://t.co/kzaGbIHSIA
We just shipped a new ChartMogul feature inspired by those strangely addictive YouTube bar-chart race videos.
"Compare Regional Performance" animates how your business has grown across countries over time, ranked by Paid Subscribers, MRR, or ARR. Here’s a video showing how it works 👇
ChartMogul MCP is now verified and live in Claude's Connectors Directory 🙌https://t.co/4fMkiG78Eo
Very solid turnaround from @AnthropicAI considering how swamped they probably are 👏🙏
1/ June was a big month for product releases at ChartMogul.
July is going to be even bigger.
First new feature just went live this morning 👇
☀️ July 2026
🚀 Dedicated Segments page
Manage saved segments from one place: search, rename, reorder, delete, and see usage before making changes.
Folders coming soon.