Technical Trader - analyzing historical patterns & trends Examples are provided for illustrative purposes only and should not be construed as investment advice
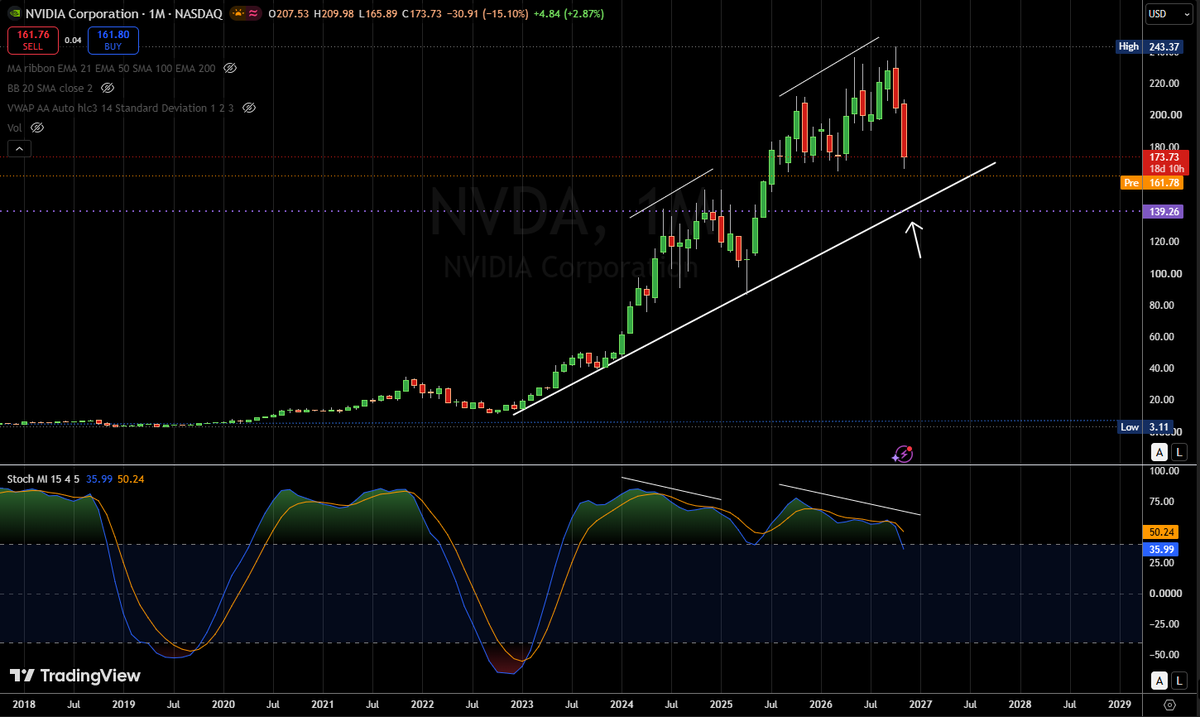
$NVDA you can see on this long-term chart , the negative divergences - while they take time to confirm
in this case 6 months to a year, they always eventually play out.
$QQQ $SPY $DIA $IWM $EEM $SPX $SPXL
Goldman's latest models (Nov 10/11): CTAs are projected to sell ~$31B out of SPX over the next week on a flat tape, and ~$41B over the next month. Even if the market rises 1.6% this week, they still model selling $23B out of SPX. Only a strong rally (+3.8% over a month) flips them to buyers. Signals are negative in ~60% of global equity markets.
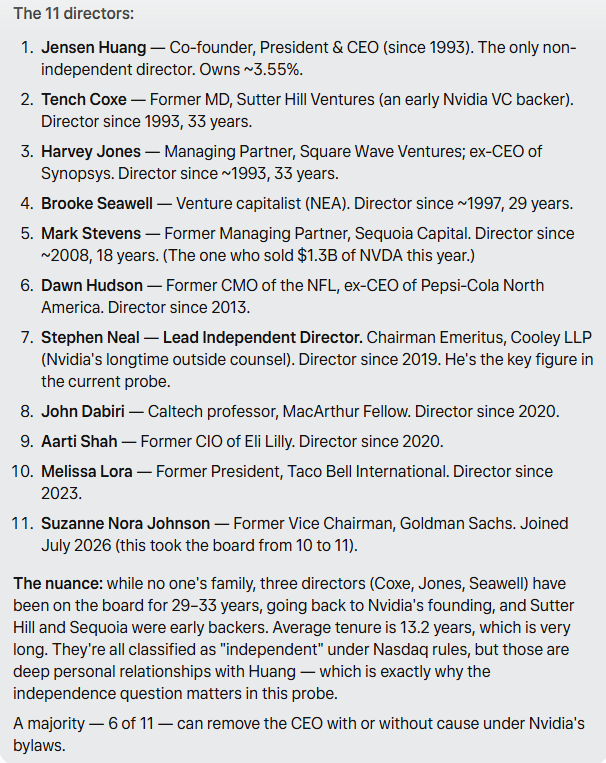
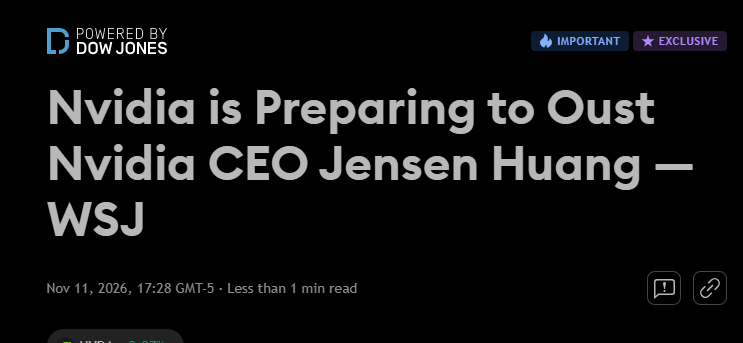
$NVDA Huang's 3.4% is the largest insider stake by dollar value in S&P 500 history, but it's not control — NVDA has single-class shares (one vote per share), no controlling owner. The board can remove him with a majority of its 11 directors.
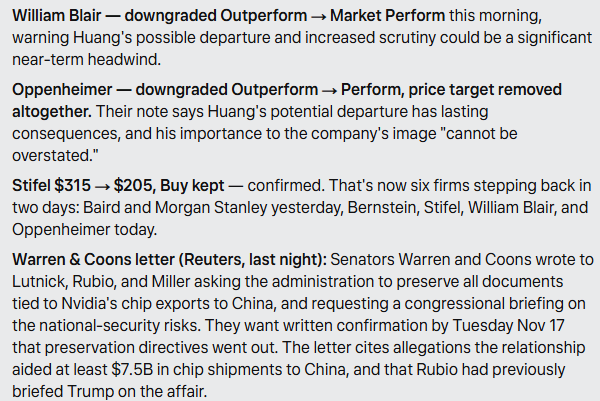
$NVDA Bernstein downgraded NVDA to Market Perform, target halved $400 → $200. Rasgon's words: "we probably haven't yet fully probed the depths of what might be found here... We've had enough, and prefer to watch from the sidelines." Earnings forecasts unchanged — he halved the multiple to ~12.7x FY28, not the numbers. That's the third broker in two days to step back: Baird Wed (Neutral, $500→$200), Morgan Stanley Wed, Bernstein now. Stifel also cut $315→$205 (Buy kept).
$QQQ $SPY $DIA $IWM $EEM
NVidia's pullback has a big effect on a number of indexes
$SMH Nvidia weighting is 20.75%
$SOXX 7.47%
Nasdaq 10.5%
Nasdaq 100 6.8%
S&P 500 6.75%t
Interesting that it hits the Nasdaq harder than
Nasdaq 100
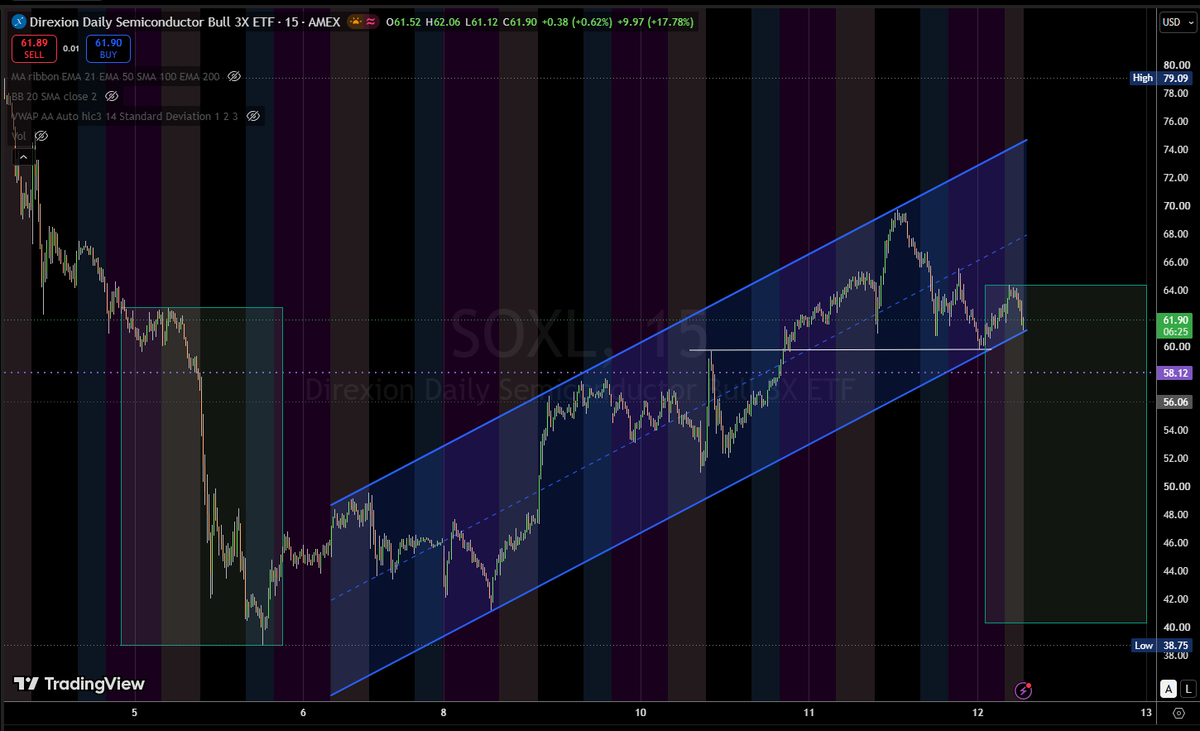
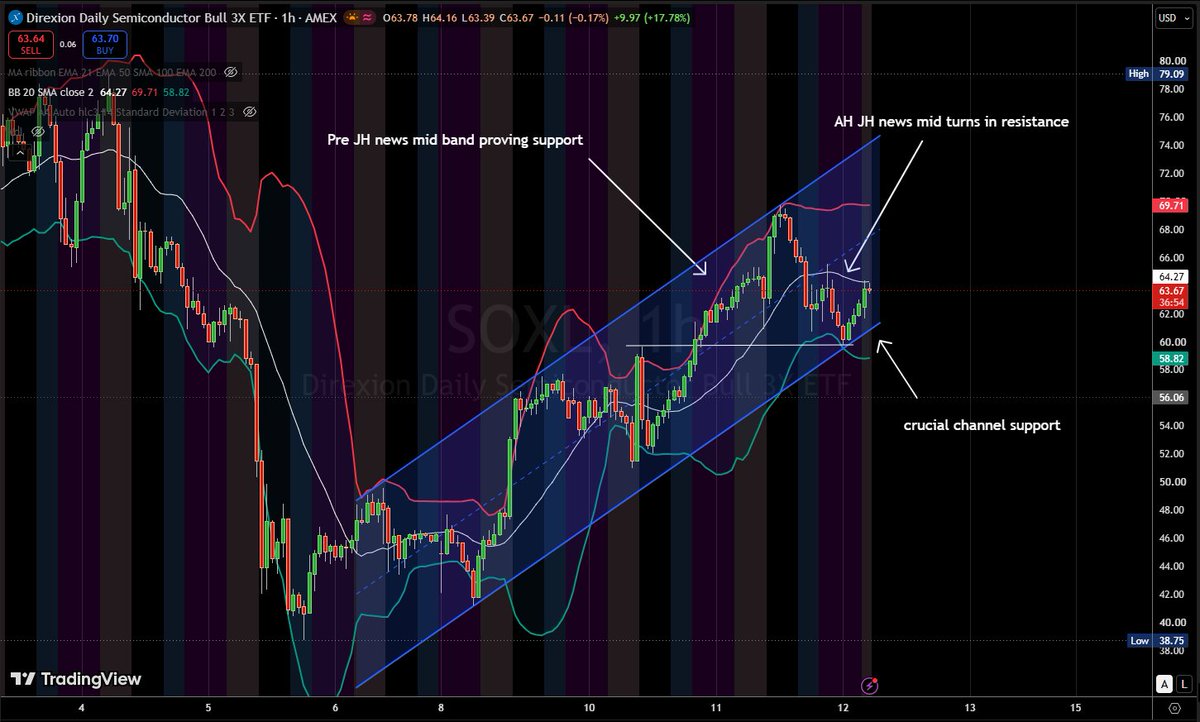
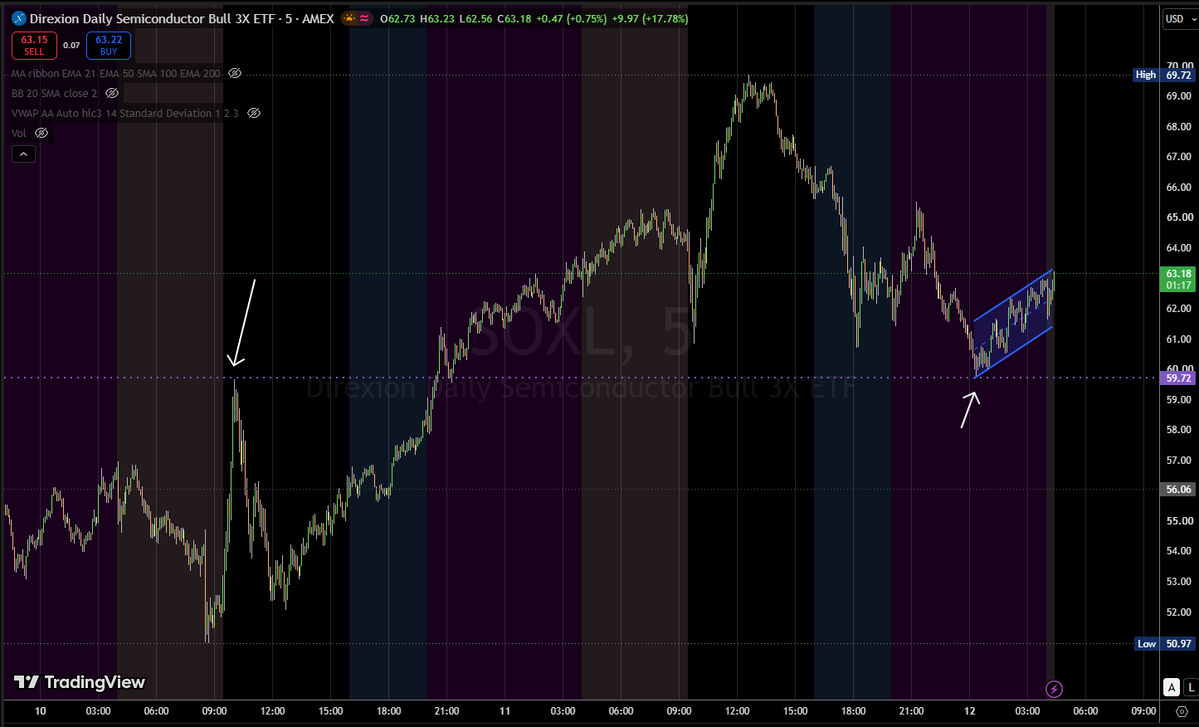
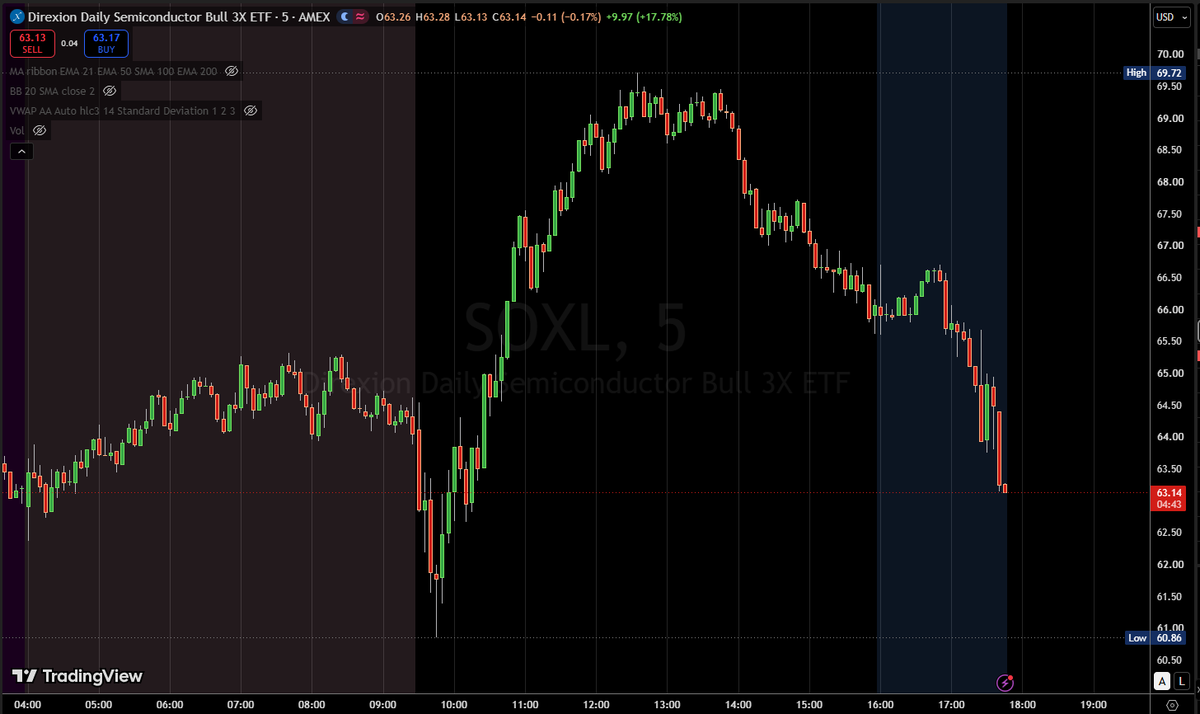
$SOXL Overnight it dropped to ~$59.72 and bounced. That level is Tuesday's high — resistance turned support. The bounce is running in a rising channel (the blue lines), now at $62.67, with the channel top around $63–64.
$59.72 held, so far. That's the key support. Below it is the $56.65 mid band / happens to be the open gap on the daily.