$BTC – Between bull market confirmation and new lows
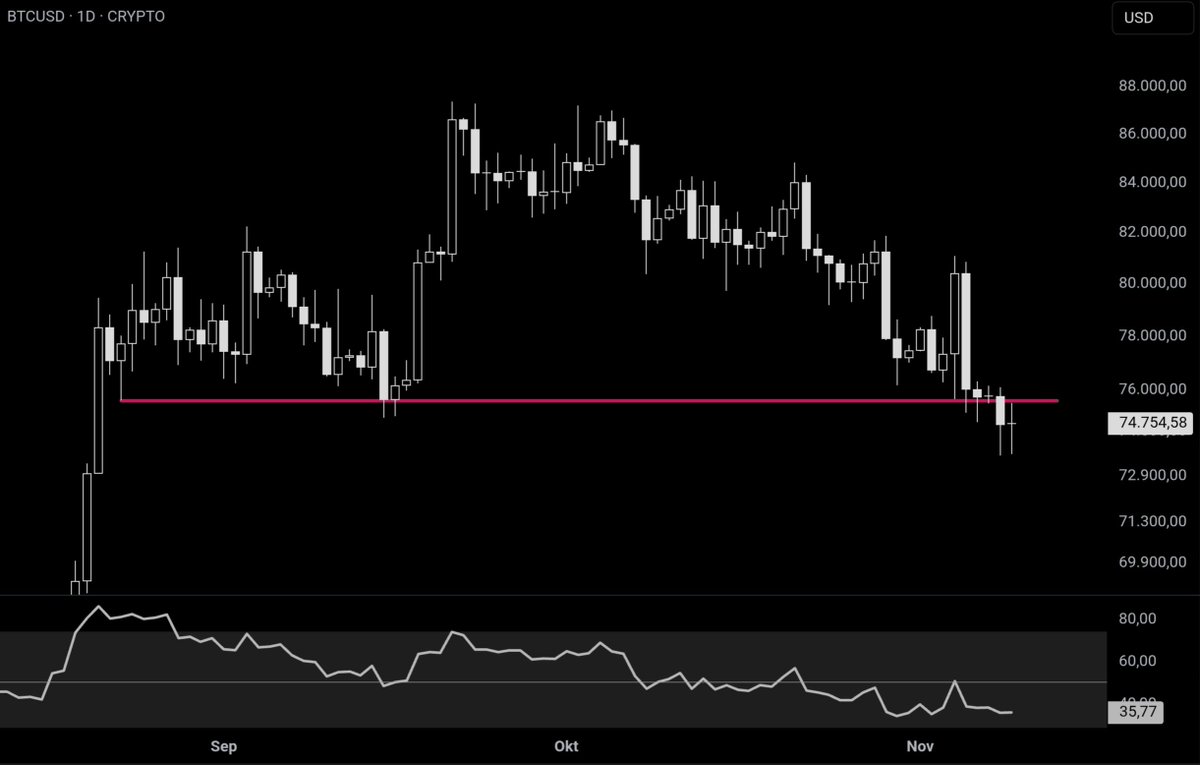
The correction ran deeper than expected, but price hasn’t shown a downward trend extension yet, matching the previous swing 1:1 and RSI at 20.
However, lower prices are back on the table.
Again, let’s see how price reacts.
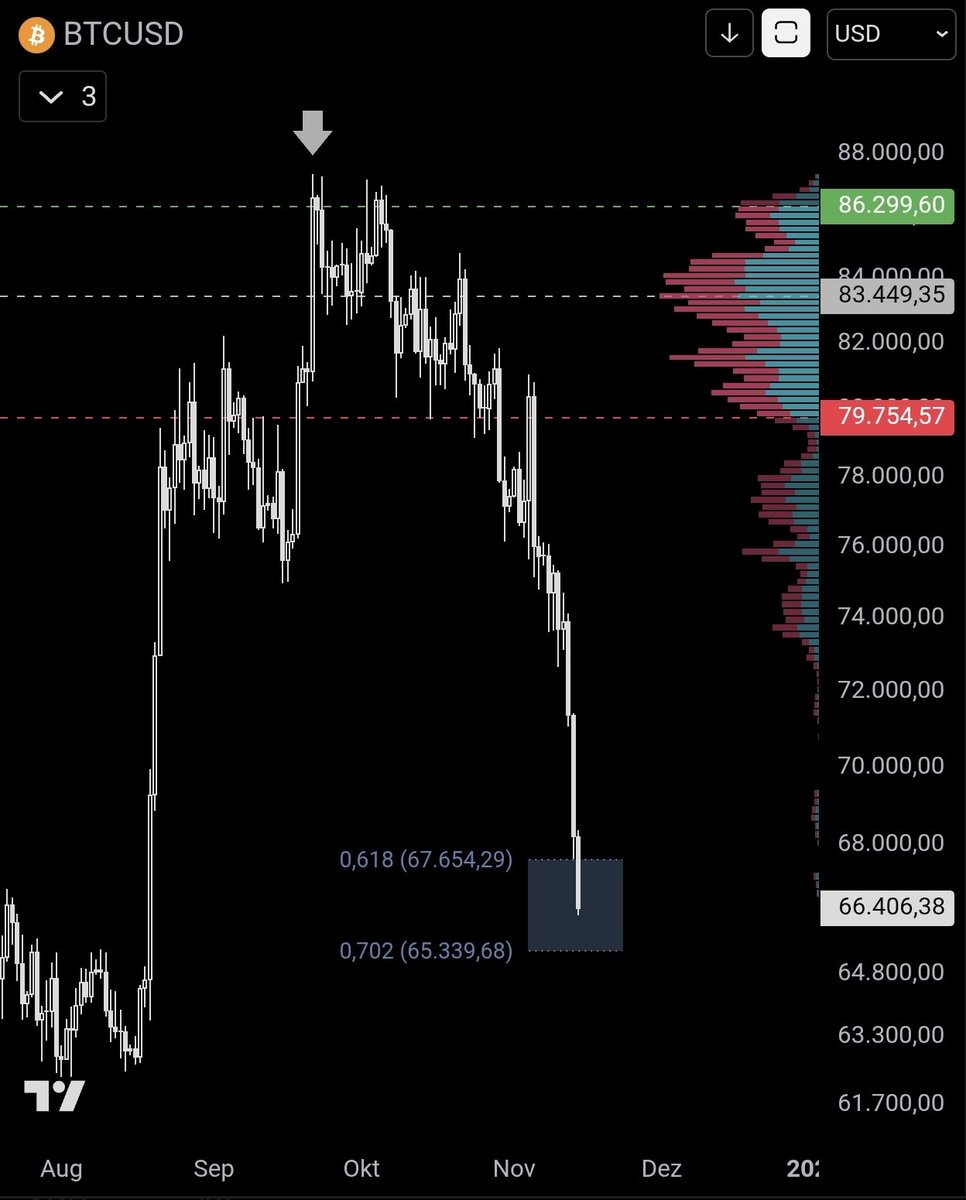
$BTC – Target zone reached
The volume vacuum played out and touched the 0.618 retrace alongside the 2021 bull-run top.
Textbook retest. Watch how price reacts from here.
@CryptoElara The two are at completely different points in terms of their structure. Nvidia is currently undergoing a correction from its peak. BTC is correcting following an initial rise—now either a counter-movement confirming a bottom, or a continuation of the downward trend.
@RobynHD Guten Morgen RobynHD, der Kurs hat genau das getan was er sollte, aktuell wäre das ein perfekter Retest.
Etwas Werbung in eigener Sache, schau mal bei mir vorbei 😉
LG
$BTC – Target zone reached
The volume vacuum played out and touched the 0.618 retrace alongside the 2021 bull-run top.
Textbook retest. Watch how price reacts from here.
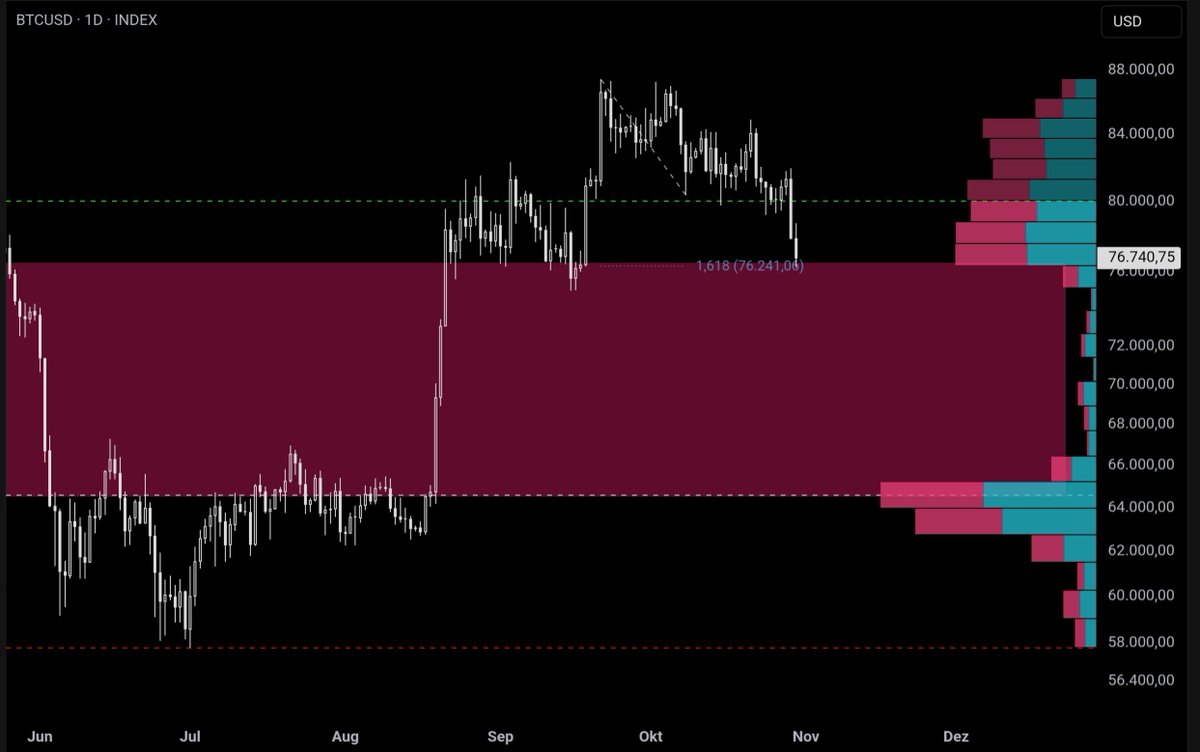
$BTC – High timeframe risk
Price is testing the 50 MA 1W and the edge of the volume vacuum.
Lose it and the void opens the door for a heavy continuation into the Golden Pocket & 0.702 cluster below.
$NVDA – A structural thought (1W / 1M)
Flushed straight into the 2.0 extension.
Watching if a relief bounce stalls at $184–190.
From there, we could see a move toward the 0.236 level on the 1M timeframe.
@Morecryptoonl *An old chart of mine.
As I see it, the 0.236 level has been reached on both the smaller and larger timeframes. Now it all comes down to the retest, whether it results in an HL or an LL.
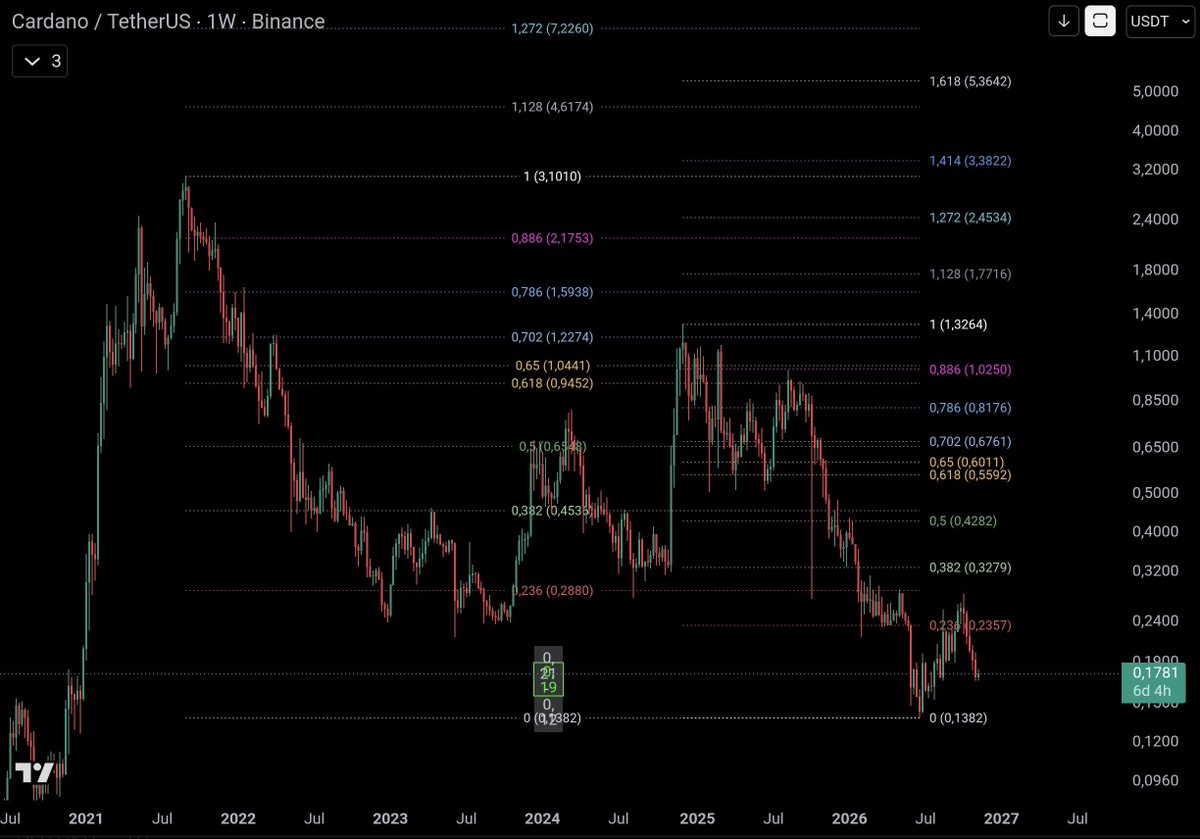
@professornode Consolidation, breakout, retest, follow through.
The 3rd line defines the current range floor. Expecting sideways chop within these levels until one side breaks.
@Steven06948247@RobynHD@glassnode Of course, it depends on which movement you want to look at:
- are you referring to the entire last bull run,
- the sell-off from the top, the rebound following that sell-off,
- or the current sell-off within that rebound?
@Steven06948247@RobynHD@glassnode Good point. Let’s discuss which levels on the chart are relevant and where it makes the most sense to anchor a volume profile.
$BTC – High timeframe risk
Price is testing the 50 MA 1W and the edge of the volume vacuum.
Lose it and the void opens the door for a heavy continuation into the Golden Pocket & 0.702 cluster below.
$BTC -The structure was already there. The binance hack is just the catalyst
There is nothing better than a fresh crypto exchange hack to provide the final flush, just like FTX in the previous bear market.
Next is a massive low-volume gap. With support and the 0.702 Fib Level