@TheDataHubX Regional GDP is one measure of economic weight, while billionaire rankings tell a different story. Zhang Yiming is now Asia’s richest by a razor-thin margin.
https://t.co/zRVihOBUAy
Asia has a new richest person—and the lead is only $700 million.
ByteDance founder Zhang Yiming reached $105.5B, narrowly overtaking Gautam Adani at $104.8B on Bloomberg's September 15 snapshot.
Zhang was worth $13B when Bloomberg began tracking him in 2019. He is now at more than 8× that level, with TikTok and ByteDance's AI push behind the revaluation.
One ranking change, two very different wealth engines: algorithms and AI versus ports, energy and infrastructure.
How long will the new No. 1 hold?
Data: Bloomberg Billionaires Index (Sep 15, 2026)
More data, more insights — explore CnDataSeed: https://t.co/VmadyFwNCa
@Forbes Wild how fast these founder net worths shift. Speaking of billionaire ranking moves, I had a post out earlier on Zhang Yiming just becoming Asia’s richest — the margin over Adani is only $700M, with AI and TikTok driving that surge.
https://t.co/zRVihOBUAy
Asia has a new richest person—and the lead is only $700 million.
ByteDance founder Zhang Yiming reached $105.5B, narrowly overtaking Gautam Adani at $104.8B on Bloomberg's September 15 snapshot.
Zhang was worth $13B when Bloomberg began tracking him in 2019. He is now at more than 8× that level, with TikTok and ByteDance's AI push behind the revaluation.
One ranking change, two very different wealth engines: algorithms and AI versus ports, energy and infrastructure.
How long will the new No. 1 hold?
Data: Bloomberg Billionaires Index (Sep 15, 2026)
More data, more insights — explore CnDataSeed: https://t.co/VmadyFwNCa
Asia has a new richest person—and the lead is only $700 million.
ByteDance founder Zhang Yiming reached $105.5B, narrowly overtaking Gautam Adani at $104.8B on Bloomberg's September 15 snapshot.
Zhang was worth $13B when Bloomberg began tracking him in 2019. He is now at more than 8× that level, with TikTok and ByteDance's AI push behind the revaluation.
One ranking change, two very different wealth engines: algorithms and AI versus ports, energy and infrastructure.
How long will the new No. 1 hold?
Data: Bloomberg Billionaires Index (Sep 15, 2026)
More data, more insights — explore CnDataSeed: https://t.co/VmadyFwNCa
@jackprandelli This makes total sense. Geopolitics grabs headlines, but Chinese crude import flows are doing the heavy lifting setting Brent prices right now.
@simongerman600 These numbers hit hard. The math is simple: fewer workers carrying the pension and healthcare load, and younger generations will end up footing the bill.
@CaitlinDoornbos The sidelines really are where a lot of the meaningful coordination happens, aren’t they? This Pakistan-Saudi rapprochement is worth watching.
What does cross-border labor mobility look like beyond headline hiring numbers? 👀
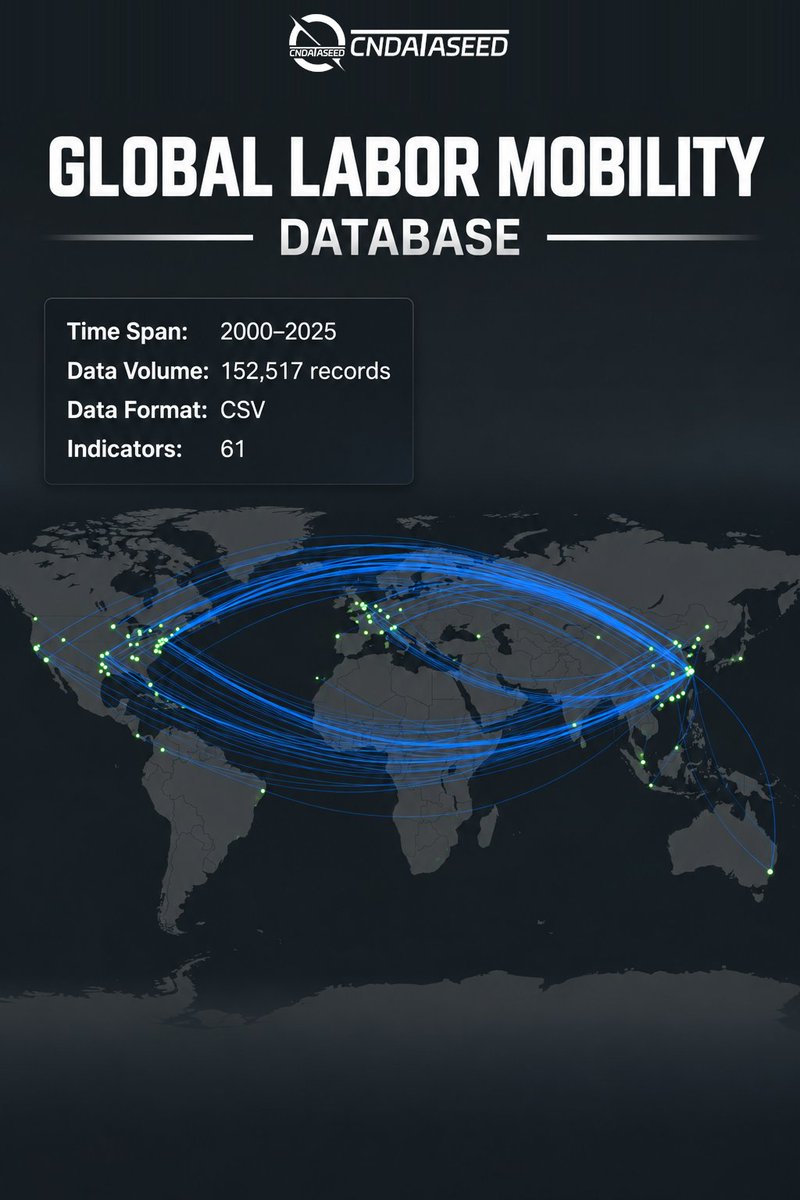
We’re looking at the data behind it — 152,517 records from 2000–2025, organized across 61 indicators in CSV format.
The database connects job records, company-level talent flows, regional mobility, and AI-skill exposure to provide a more structured view of how workers and skills move.
Which talent flow would you investigate first?
From 2000 to 2025: 152,517 records tracing how talent moves across companies, cities, and countries.
CnDataSeed’s Global Labor Mobility Database brings together 61 indicators covering cross-border employment histories, company transitions, regional talent flows, and changes in occupational exposure to AI.
Available in CSV format, the database includes employment spells, origin and destination companies, job titles, O*NET occupation codes, job-change timing and distance, salary and compensation information, regional mobility statistics, and AI skill-exposure indicators.
By connecting individual employment records with company and geographic transitions, the collection gives researchers material to examine where talent moves, how careers develop, and how exposure to AI-related change varies across jobs.
If you could follow one talent flow across companies, cities, and countries, which route would you explore?
More data, more insights — explore CnDataSeed: https://t.co/VmadyFwNCa
From 2000 to 2025: 152,517 records tracing how talent moves across companies, cities, and countries.
CnDataSeed’s Global Labor Mobility Database brings together 61 indicators covering cross-border employment histories, company transitions, regional talent flows, and changes in occupational exposure to AI.
Available in CSV format, the database includes employment spells, origin and destination companies, job titles, O*NET occupation codes, job-change timing and distance, salary and compensation information, regional mobility statistics, and AI skill-exposure indicators.
By connecting individual employment records with company and geographic transitions, the collection gives researchers material to examine where talent moves, how careers develop, and how exposure to AI-related change varies across jobs.
If you could follow one talent flow across companies, cities, and countries, which route would you explore?
More data, more insights — explore CnDataSeed: https://t.co/VmadyFwNCa
As of Sept. 21, Nepal Police reports 1,451 deaths, while the number of people on its missing-person register has fallen to 4,655 (−1,131). Search and identification efforts continue, with 3,283 DNA samples collected so far.
May every family still waiting for news receive answers soon.
166.5 million patent records. What’s inside them?
Patent counts tell you how much has been published. Titles, abstracts, classifications, and keywords give you material to investigate what those inventions are actually about.
From 1782 to 2025: more than two centuries of patent records in one database.
We’ve compiled 166,466,499 records in CnDataSeed’s Global Patent Text Vector Database, bringing a long historical perspective to research on technological change.
The dataset includes original and translated titles and abstracts, CPC classifications, keywords, similar-patent references, and vector representations. It offers 15 fields in CSV format for further analysis.
Today’s technologies have long histories. This collection gives researchers material to explore how ideas, terminology, and technical approaches have changed.
If you could trace one technology back through the patent record, which would you choose?
More data, more insights — explore CnDataSeed: https://t.co/VmadyFwfMC
From 1782 to 2025: more than two centuries of patent records in one database.
We’ve compiled 166,466,499 records in CnDataSeed’s Global Patent Text Vector Database, bringing a long historical perspective to research on technological change.
The dataset includes original and translated titles and abstracts, CPC classifications, keywords, similar-patent references, and vector representations. It offers 15 fields in CSV format for further analysis.
Today’s technologies have long histories. This collection gives researchers material to explore how ideas, terminology, and technical approaches have changed.
If you could trace one technology back through the patent record, which would you choose?
More data, more insights — explore CnDataSeed: https://t.co/VmadyFwfMC
@BullTheoryio The Inverse Cramer indicator strikes again! Cramer sold all his BTC, and Bitcoin ripped +31%. The legendary contrarian signal still works.
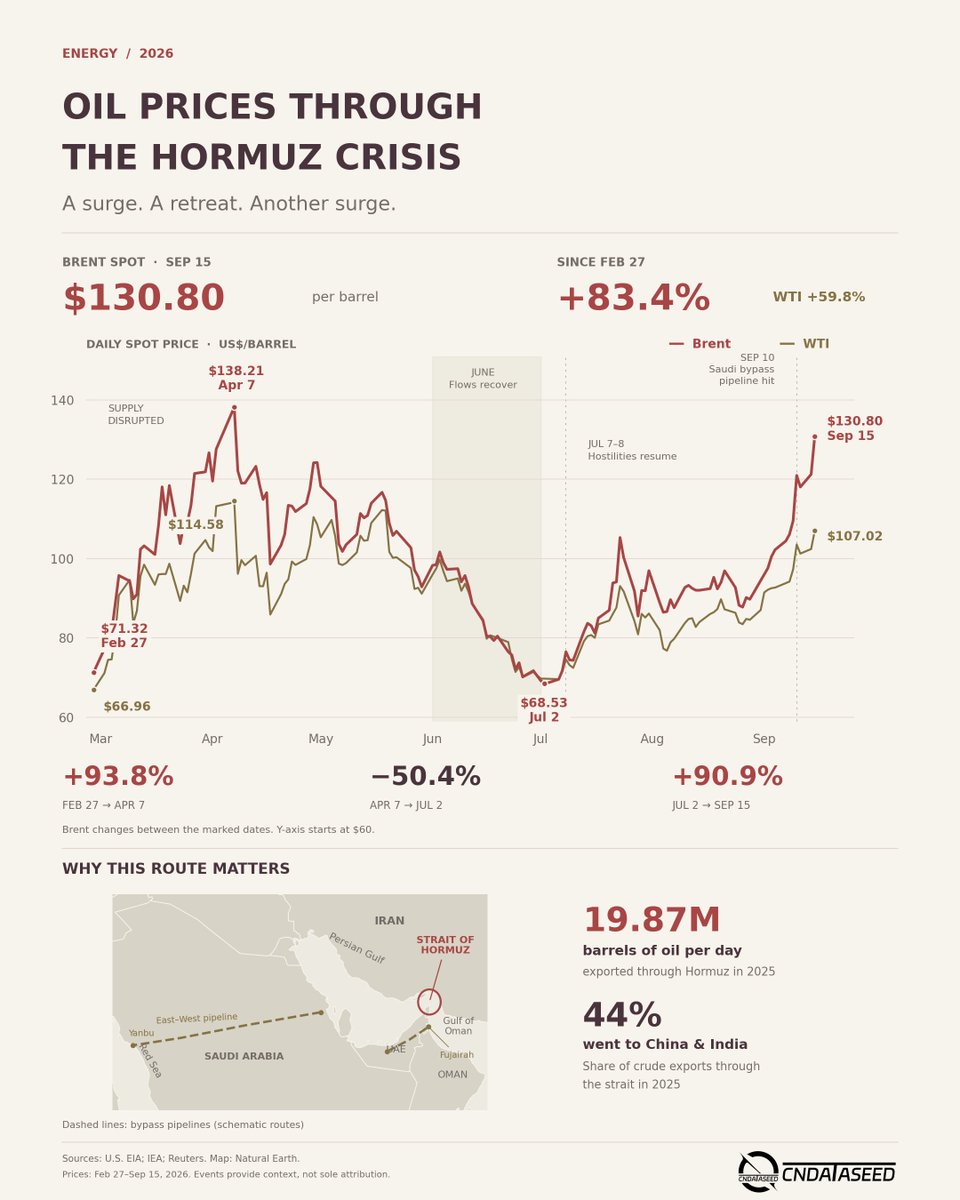
China and India received 44% of the crude oil exported through the Strait of Hormuz in 2025. This year’s oil-price swings show why that route demands attention.
Across crude and oil products, 19.87 million barrels a day passed through the strait in 2025. That is the scale of the trade exposed when shipping is disrupted.
Our 2026 chart follows the volatility: Brent spot prices rose from $71.32 on February 27 to $138.21 on April 7, retreated to $68.53 on July 2, then reached $130.80 on September 15.
For Asian energy buyers, the questions extend beyond the next Brent or WTI headline: can cargoes arrive reliably, and can alternative routes absorb the disruption?
Which should we chart next: oil-import dependence, tanker flows, or shipping costs?
Trouble in the Strait of Hormuz, and crude oil starts climbing—fast.
That pattern played out dramatically in 2026. Between February and September, Brent nearly doubled, plunged by half, then surged almost 91% again.
The key prices:
• Feb 27: $71.32/barrel
• Apr 7: $138.21
• Jul 2: $68.53
• Sep 15: $130.80
Brent jumped 93.8% from Feb 27 to Apr 7, fell 50.4% by Jul 2, then rebounded 90.9% by Sep 15. Even after all that volatility, it remained 83.4% above its February level. WTI was up 59.8% over the same period.
Our chart follows the full daily series against disruptions in tanker traffic, recovering oil flows and renewed hostilities around Hormuz.
The market can price in returning supply very quickly. Keeping that supply flowing is another story.
What would signal real stabilization to you: cheaper oil, normal tanker traffic, or both?
#Hormuz #OilPrices #Energy
More data, more insights — explore CnDataSeed: https://t.co/VmadyFwNCa
@HormuzLetter This is the third time MBS asked Trump to hit the Houthis. Will Saudi Arabia have to face Houthi pressure alone, with no US military backup?https://t.co/DF07dKUcYu
Trouble in the Strait of Hormuz, and crude oil starts climbing—fast.
That pattern played out dramatically in 2026. Between February and September, Brent nearly doubled, plunged by half, then surged almost 91% again.
The key prices:
• Feb 27: $71.32/barrel
• Apr 7: $138.21
• Jul 2: $68.53
• Sep 15: $130.80
Brent jumped 93.8% from Feb 27 to Apr 7, fell 50.4% by Jul 2, then rebounded 90.9% by Sep 15. Even after all that volatility, it remained 83.4% above its February level. WTI was up 59.8% over the same period.
Our chart follows the full daily series against disruptions in tanker traffic, recovering oil flows and renewed hostilities around Hormuz.
The market can price in returning supply very quickly. Keeping that supply flowing is another story.
What would signal real stabilization to you: cheaper oil, normal tanker traffic, or both?
#Hormuz #OilPrices #Energy
More data, more insights — explore CnDataSeed: https://t.co/VmadyFwNCa
@business Diplomatic talks between Pakistan and Iran secure safe Hormuz passage for another LNG cargo. It offers temporary relief for Pakistan’s acute energy crunch, though this ad‑hoc deal is no long‑term fix for regional shipping risks.
https://t.co/DF07dKUcYu
Trouble in the Strait of Hormuz, and crude oil starts climbing—fast.
That pattern played out dramatically in 2026. Between February and September, Brent nearly doubled, plunged by half, then surged almost 91% again.
The key prices:
• Feb 27: $71.32/barrel
• Apr 7: $138.21
• Jul 2: $68.53
• Sep 15: $130.80
Brent jumped 93.8% from Feb 27 to Apr 7, fell 50.4% by Jul 2, then rebounded 90.9% by Sep 15. Even after all that volatility, it remained 83.4% above its February level. WTI was up 59.8% over the same period.
Our chart follows the full daily series against disruptions in tanker traffic, recovering oil flows and renewed hostilities around Hormuz.
The market can price in returning supply very quickly. Keeping that supply flowing is another story.
What would signal real stabilization to you: cheaper oil, normal tanker traffic, or both?
#Hormuz #OilPrices #Energy
More data, more insights — explore CnDataSeed: https://t.co/VmadyFwNCa
@Polymarket Sharp drop in tracked commodity vessels through the Strait of Hormuz, from 35 to only 12 week-on-week. This chokepoint remains extremely sensitive to regional tensions, with big implications for global energy supply.
https://t.co/DF07dKUcYu
Trouble in the Strait of Hormuz, and crude oil starts climbing—fast.
That pattern played out dramatically in 2026. Between February and September, Brent nearly doubled, plunged by half, then surged almost 91% again.
The key prices:
• Feb 27: $71.32/barrel
• Apr 7: $138.21
• Jul 2: $68.53
• Sep 15: $130.80
Brent jumped 93.8% from Feb 27 to Apr 7, fell 50.4% by Jul 2, then rebounded 90.9% by Sep 15. Even after all that volatility, it remained 83.4% above its February level. WTI was up 59.8% over the same period.
Our chart follows the full daily series against disruptions in tanker traffic, recovering oil flows and renewed hostilities around Hormuz.
The market can price in returning supply very quickly. Keeping that supply flowing is another story.
What would signal real stabilization to you: cheaper oil, normal tanker traffic, or both?
#Hormuz #OilPrices #Energy
More data, more insights — explore CnDataSeed: https://t.co/VmadyFwNCa
Trouble in the Strait of Hormuz, and crude oil starts climbing—fast.
That pattern played out dramatically in 2026. Between February and September, Brent nearly doubled, plunged by half, then surged almost 91% again.
The key prices:
• Feb 27: $71.32/barrel
• Apr 7: $138.21
• Jul 2: $68.53
• Sep 15: $130.80
Brent jumped 93.8% from Feb 27 to Apr 7, fell 50.4% by Jul 2, then rebounded 90.9% by Sep 15. Even after all that volatility, it remained 83.4% above its February level. WTI was up 59.8% over the same period.
Our chart follows the full daily series against disruptions in tanker traffic, recovering oil flows and renewed hostilities around Hormuz.
The market can price in returning supply very quickly. Keeping that supply flowing is another story.
What would signal real stabilization to you: cheaper oil, normal tanker traffic, or both?
#Hormuz #OilPrices #Energy
More data, more insights — explore CnDataSeed: https://t.co/VmadyFwNCa