NH Housing is releasing our report on the potential impact of new affordable housing on surrounding property values. We analyzed 93 affordable housing developments linked to more than 68,000 open market home sales and found no measurable effect. https://t.co/uMMKzejWcP
We're excited to be sharing https://t.co/ysofiyLR0I our regional housing data platform at the @Assoc_MPOs conference next week in Sacramento, find us at our booth!
250 years of housing 🇺🇸 this visualization uses 88 million dated property records to show the age and history of today's homes. #America250#US250#Housing
Inclusionary housing needs to be legally grounded in a nexus study that establishes a rational link between new market-rate housing and affordable housing demand. The Met Council released the Regional Housing Nexus Study we built using public data https://t.co/sIBHwrtIDp
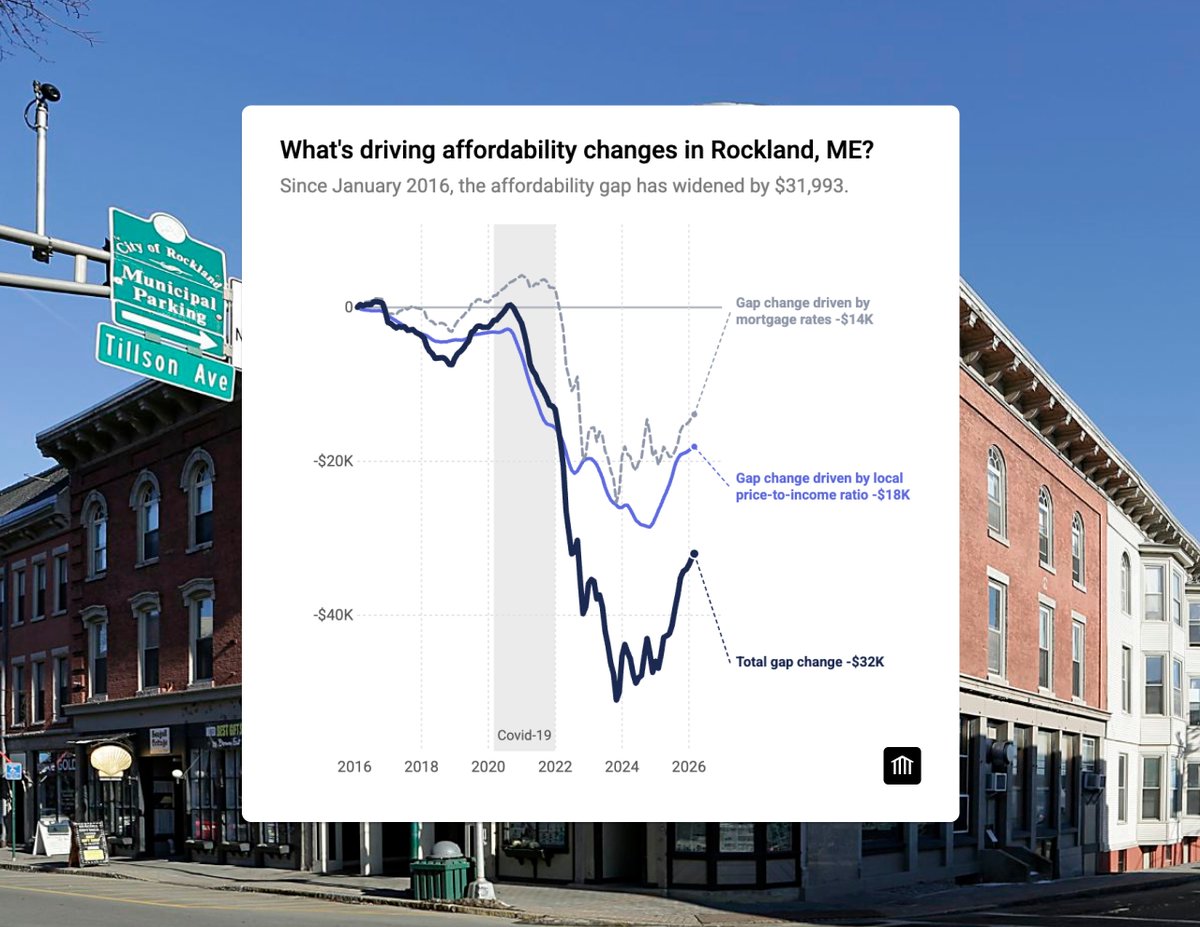
https://t.co/maShGGSxKC The @CityOfRockland is notable in that it has already identified that it has a housing crisis, already adopted permissive zoning for housing, and, while we were engaged with the community, passed a $10M housing bond to support workforce housing.
This #fairhousing month we analyzed counties and municipalities to measure how housing growth, cost burden, and racial disparity interact. Interactive charts https://t.co/O05IK0YeD3
We built https://t.co/Cj7HKXEBpW to tell every US community's housing story with time series data from ACS, BLS, HUD, and additional sources.
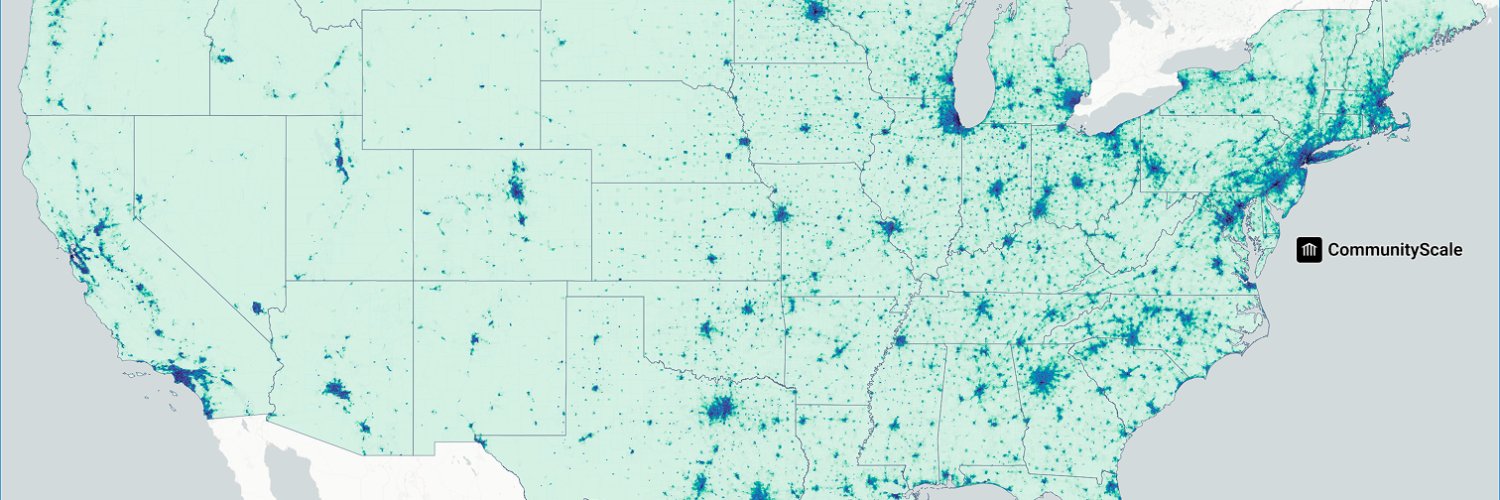
Read more and explore the map: https://t.co/w5z5kXpSCO
#housing#urbanplanning#data
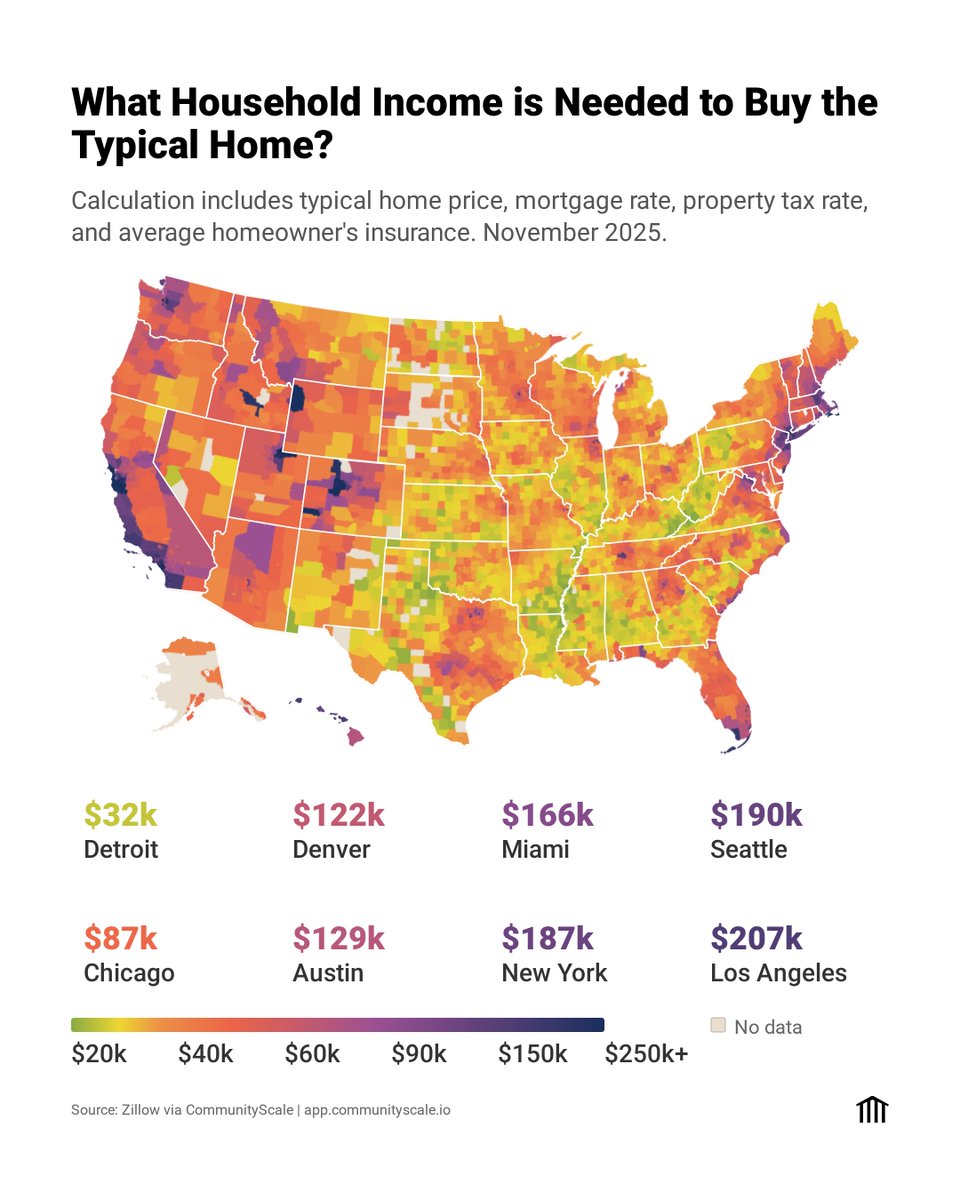
Where can your household's income afford the typical home? Interactive map combines typical home prices, mortgage rates, property taxes, and insurance into a single number -- check it out on the homepage of https://t.co/oSkjAB0ixf #Affordability#Housing#UrbanPlanning
You'd need to earn $4M/year to afford the typical home on Jupiter Island, FL. Beverly Hills? Just $742K. Even in Jackson Hole, it's "only" $518K. America's new gilded age is rewriting the map of housing affordability. https://t.co/Cj7HKXEBpW
#housing#affordability#gildedage
CommunityScale's housing affordability data combines monthly home value estimates with current mortgage rates, property taxes, and homeowner's insurance. Find your community at https://t.co/oSkjAB0ixf
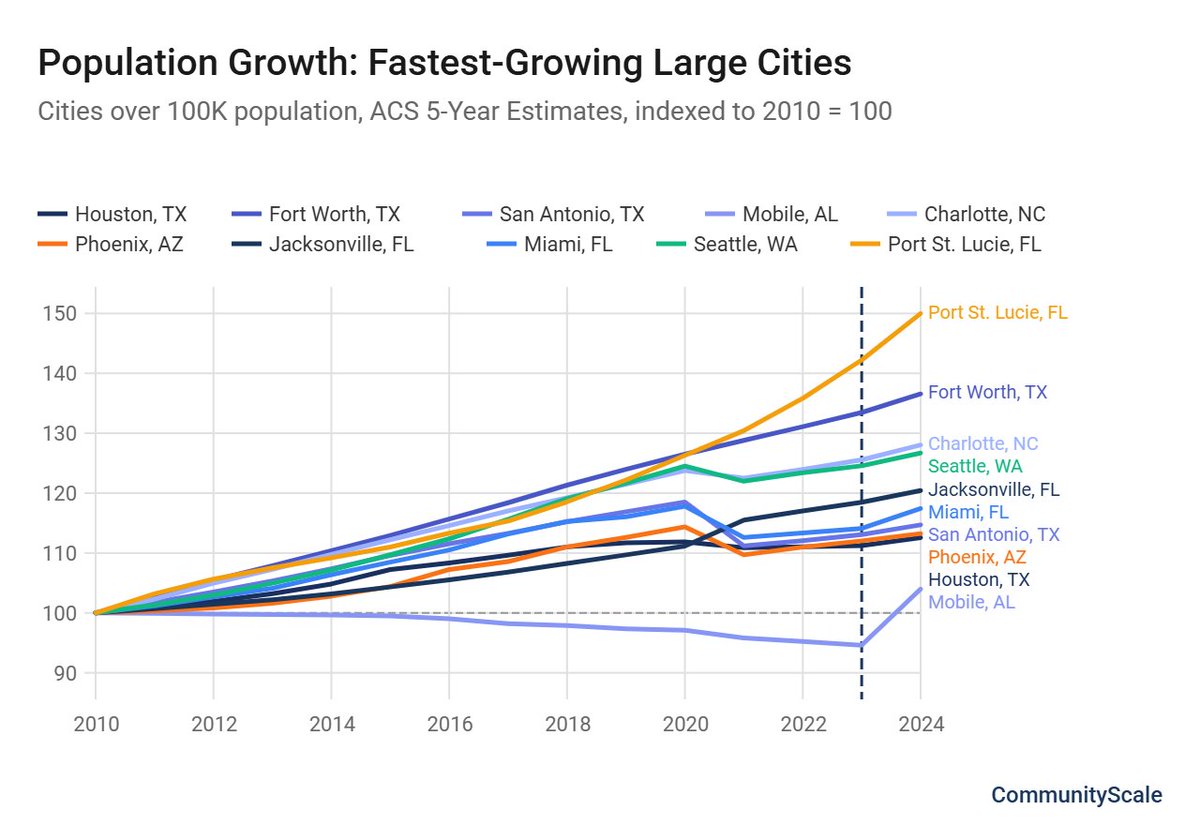
https://t.co/o0eGyC50qj We finally got our arms around the 2024 ACS data. The Sun Belt boom continued. 79 of 91 large cities saw renter share drop below trend. Full analysis on our blog.
Our Housing Library, created in partnership with Neighbor Architects, includes 11 middle density housing types with multiple variations, illustrating a density range from 26 to 86 units per acre. https://t.co/2ndQBl7fC5