Why the 4-Year Cycle Is Dead (Lessons from My Mistakes!)
Part 02: Business Cycle and Equities
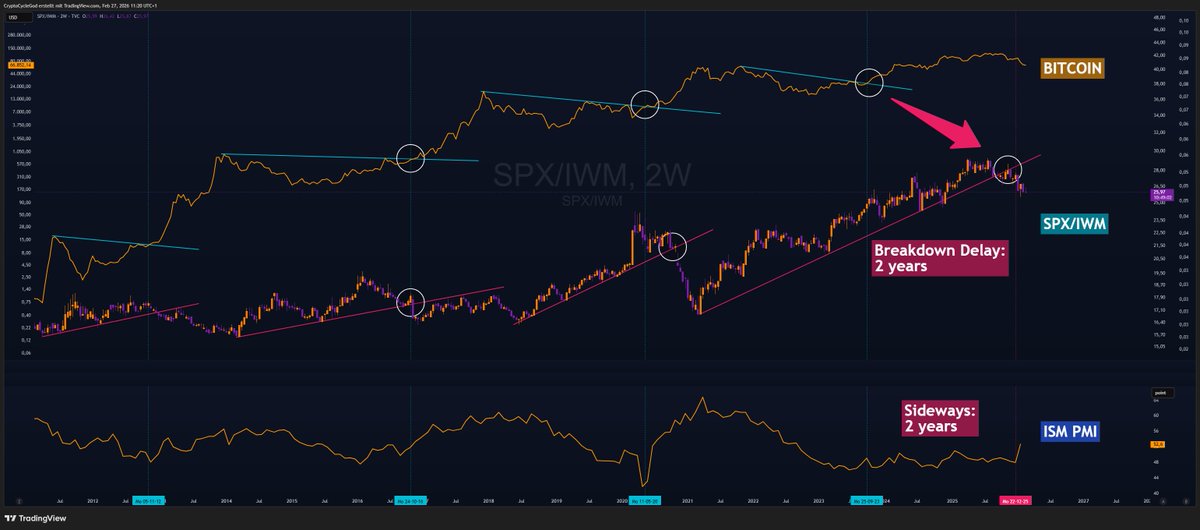
Another mistake I made: I sticked for too long to the 4 year cycle repetition. But from beginning of 2024 on, I could and should have seen, that the cycle was broken.
As you can see, before we had a clear inverse correlation: $SPX / $IWM breaking down, $BTC breaking out. Within a few months.
As you can see, this was about 4 years apart and is also clearly visible as "waves" in the ISM PMI metric.
In September 2023 Bitcoin broke out. But SPX/IWM kept riping (just several trendline retests, but with a clear uptrend ongoing). On the ISM PMI was just a small, shortlived spike.
Two(!) years later we got the breakdown on SPX/IWM. And ISM PMI starting to breakout to the upside (confirmation next week).
We had two years of sideways for ISM PMI, which happens for the first time in the history of Bitcoin.
This is another reason, why the 4 year cycle is broken. You can ignore that and stick to your cycle. Or act accordingly.
Why the 4-Year Cycle Is Dead (Lessons from My Mistakes!)
Part 01: US Net Liquidity
Another metric showing we are at the bottom and operating in a different environment than before is US Net Liquidity.
One key reason why cycles (liquidity, debt, credit, economy – and therefore crypto) have become significantly longer:
The yellow line below represents US Net Liquidity (FRED data): the ratio of US M2 money supply to US debt.
We are in the endgame of the 100+ year overarching debt supercycle – and this is the longest downward phase without any interim spike since Bitcoin's inception.
What does this mean?
Since late Q3 2021, liquidity in the US market has been steadily declining.
Remarkably: the entire Bitcoin bull run so far has occurred during strong and sustained falling liquidity. A situation never seen to this extent before.
There was a moderate, gradual increase from late 2024 to mid-2025 (the period when I mistakenly called the start of Altseason). But it was never a sharp spike.
The yellow bars mark historical phases of sharp, uninterrupted rises in US Net Liquidity. Pattern observed:
Every such sharp rise occurred at the beginning of – or during – a parabolic move, right up to the cycle top.
That’s exactly why I (wrongly) expected a parabolic phase starting late 2024 / early 2025:
- US Net Liquidity (and other metrics) began rising, including globally
- The timing seemed to fit perfectly into the 4-year cycle framework
- Macro conditions started improving
My main mistakes:
- The liquidity increase was only moderate, not sharp
- I relied too heavily on the 4-year cycle for timing
- Macro conditions were not fully supportive
The tricky part:
Last year’s liquidity rise, followed by the subsequent drop, superficially fits the old pattern, making it easy to mistakenly believe the 4-year cycle is still intact.
In previous cycles, when liquidity moved sideways and then dipped further, the bear market had typically already ended (or was very close to ending).
Complicating matters further: since 2021/2022, the US government and FED have introduced various new facilities (BTFP, etc.) to provide banks with liquidity and collateral support – interventions that do not directly appear in the classic US Net Liquidity metric.
Accept the fact, that the evironment has changed. Accept the fact, that Bitcoin rised, because the big boys are taking over, not because the 4-year-cycle will be there forever. Accept the fact, that this time is not different – Bitcoin behaves differently because the environment changed. The correlations are still the same.
Wish your dad and your family the best. I lost both of my parents unexpectedly within two years and that was really hard. Despite having my own family, you feel kind of "alone" in the world, if that makes any sense.
And you are totally right: Those moments teach us the most valueable lessons in life.
Keep it up brother!
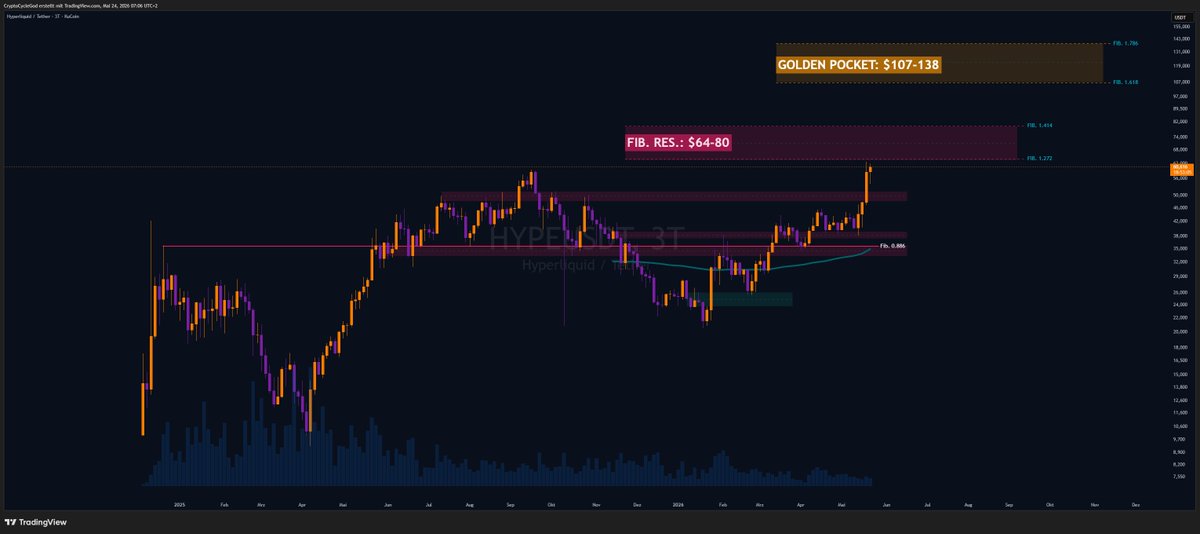
// $HYPE 3D
Hyperliquid chart works like clockwork. We got the mentioned retest of 0.886, a bit of consolidation to fuel up and the move up to the No. 1 price discovery resistance area, which is between 1.272 and 1.414.
Price can consolidate here and rip through for a dive into the Golden Pocket. Or it can go for a retest. We will see.
Don't be surprised if we reach 2.618 in Full Bull. I know it sounds insane. But that is because people do not understand, in which times we are right now.
It sounded insane for people to assume, that Gold will reach that Fib. Level on Log. Scale. Have a look at the Gold chart yourself. It tells you where good Altcoins are going.
// $HYPE 3D
Hyperliquid broke through the OB like through the resistance and the 0.886 below.
Definitely time for a retest. Even if it wants to go higher from here, I would like to see a successful retest of the 0.886 Fib. Level at some point for a healthy and strong continuation.
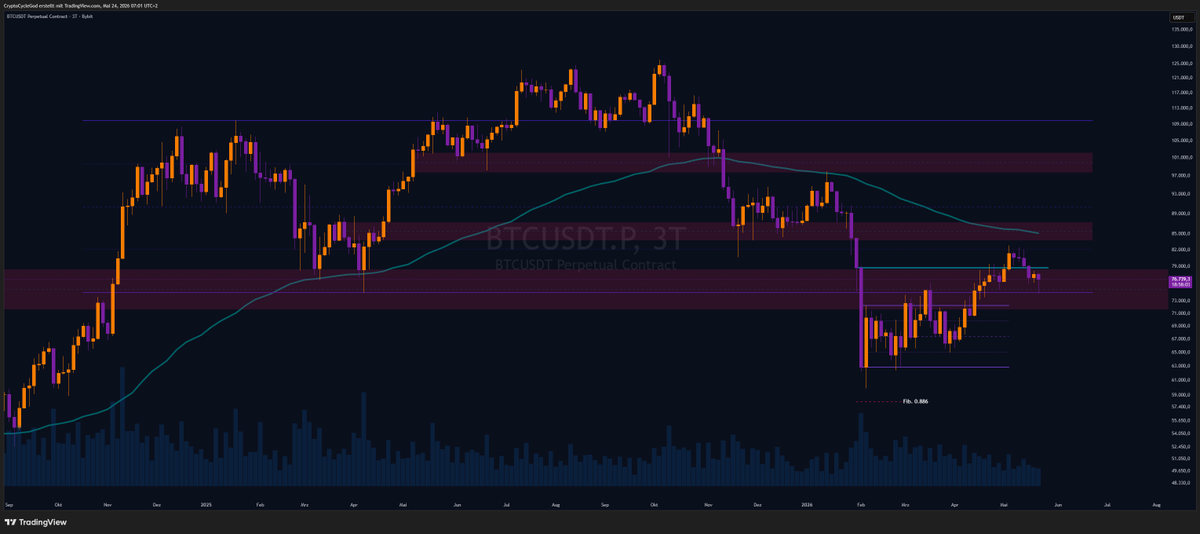
// $BTC 3D
Looks like the perfect retest so far. But as long as we are not above $86k, we are not out of the mud. Don't get me wrong: Nothing changed for me since February, when I posted, that the low is in.
But we still can fall back into the accumulation range or go for a deeper retest from here. But that is nothing to worry about.
One of the signs, that this move lacks power is the Volume, that was dropping all of the move up.
Either way: Bears are fckd <3
Gm guys! 🌅
As long as we hold this level, we’re completely fine!
For now, we’re heading for a retest of the range low.
Completely normal and clean price action.
Don’t listen to the noise from CT.
Zoom out and stay patient.
We might have a little chop ahead of us.
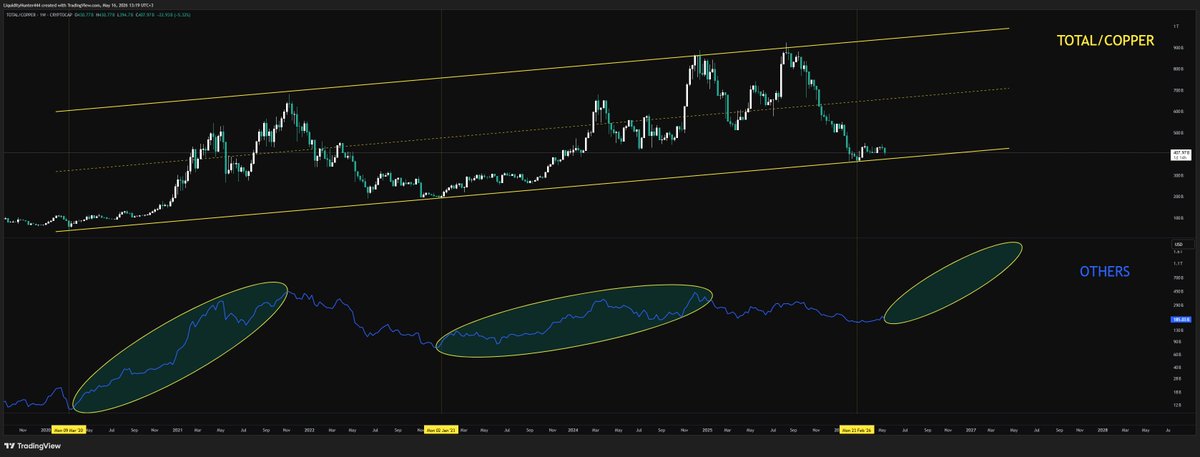
$TOTAL / $COPPER
Total/Copper is inside a multiyear channel.
Every time it has touched the lower line it has marked the bottom.
We are exactly at this level right now, so a strong bounce here is very probable.
At the same time, every time $Total / $Copper has made a bottom, $Others has started a very strong rally.
I'm expecting exactly the same outcome for $Others this time as well.
#Alts #Copper