There's been a lot of really sad stuff going on the last couple of weeks, so this lovely thread kind of slipped past me defences and made me go a little misty-eyed.
Well done Clinically Vulnerable Families for fighting on this front ❤️❤️
👀
Absolutely staggering drop in Healthy Life Expectancy in Sweden according to Eurostat.
From 73.3 years of healthy life expectancy down to 66.2.
*Sweden*.
Can no one understand how much trouble we're in?
Rates of infection with other pathogens after a +ve #COVID test versus a neg test - more brilliant work from @zalaly and team. COVID causes immune dysregulation and ⬆️risk of other infections. https://t.co/yIZ9LvD2NF
This rebuttal is brilliant, detailed, compassionate, intelligent, science based, and thorough.
The precise opposite of the statement she's replying to.
Please read, share, share, and then share. And also share:
@hannahspierMD 19/ here is a copy of our groups most recent paper on the pathophysiology of long covid
You might find it interesting
Best Wishes x
https://t.co/GCY91HJPPk
You should do this for any area in the country that's showing yellow and reporting 0%.
In every case, there's just a couple of days of the most recent data missing.
8/8
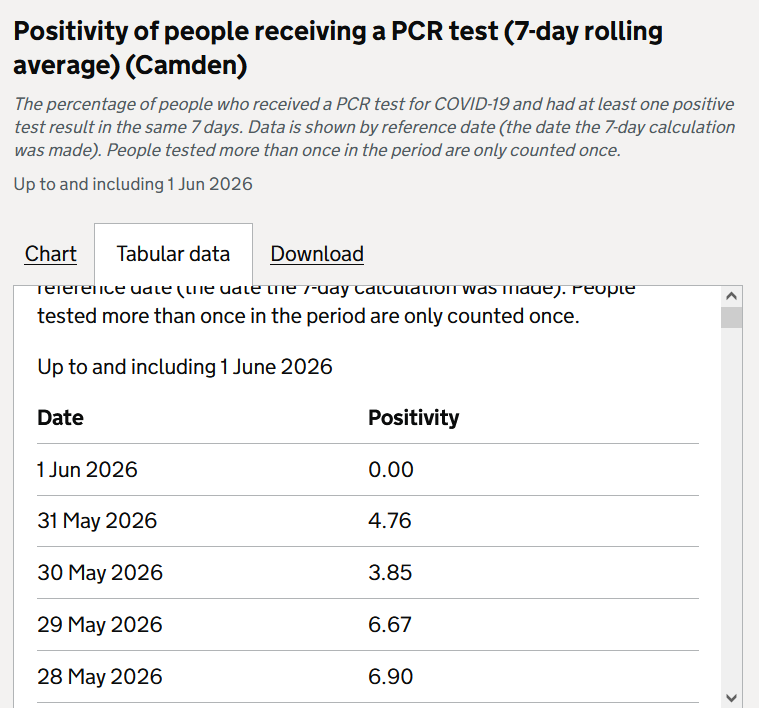
And here, we can now see there's only the last day of data missing.
Before that, it had come down a little, and was hovering at around 5%.
That's the estimate I'd take, from the last day of good data.
7/8
Take Camden as an example.
The trendline showing a drop towards the end of the line indicates reporting stopped recently.
It's now showing 0%, but if we click on the name 'Camden' in the pop-up bubble, we go straight to the underlying data.
6/8
My conclusions this week are firstly that we should disregard national estimates (for now).
Secondly, we can see there are some hotspots where reporting is good. But we can't see them where there's no reporting.
Or can we?
5/8
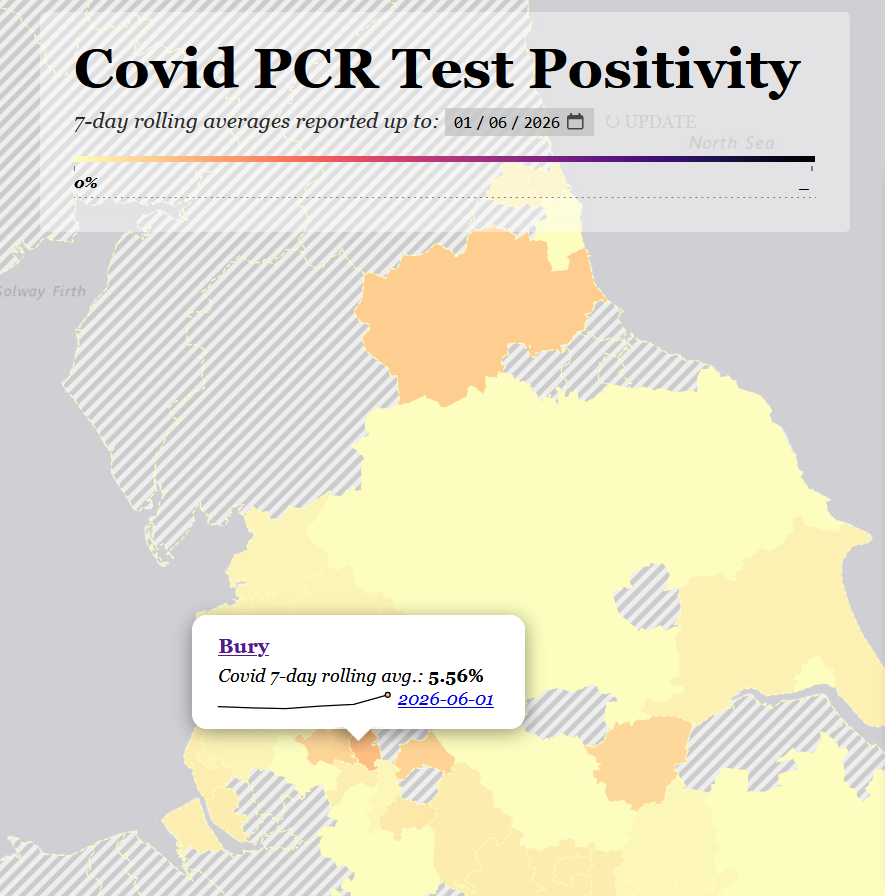
Reporting is equally poor this week in the North.
Bury's on 5.56% and there are signs of growth in surrounding areas. Durham is on 4.17%.
But the bulk of the whole map is either grey hatching (no data) or yellow (stopped reporting).
4/8
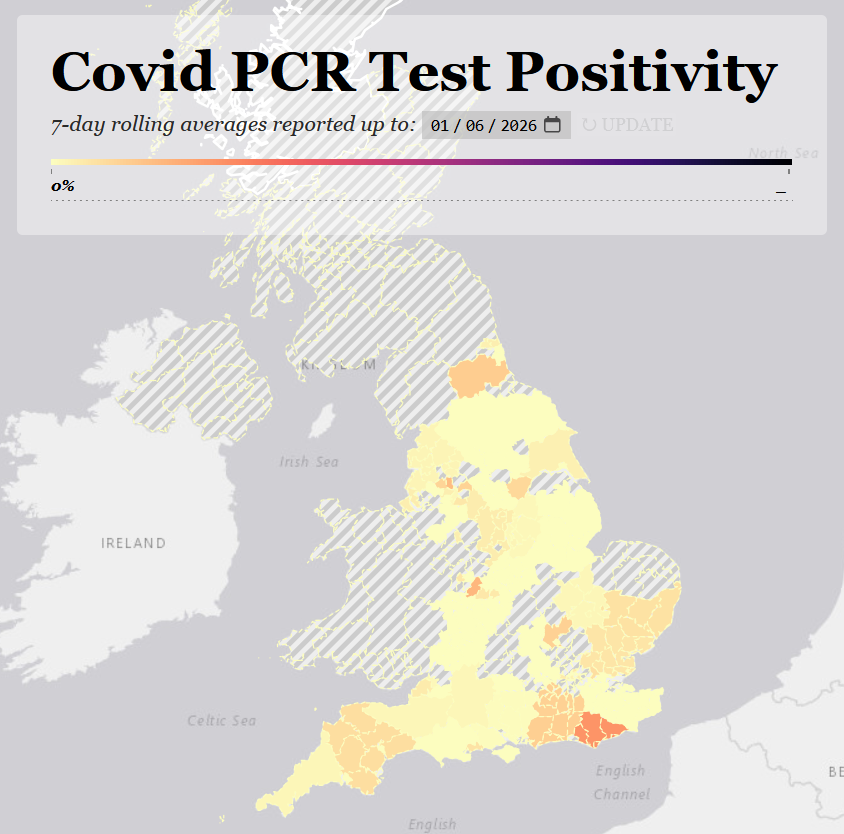
An abysmal lack of reporting across central England, with the few indicators showing a rise in Derbyshire, Central Bedfordshire, and Suffolk, and decline in Cambridgeshire.
Birmingham has risen slowly & steadily over the last 6 weeks to 6.06%, on good, reliable testing.
3/8
The elevated levels in the South continue.
Bournemouth's on 2%, Devon on 3%, W Sussex on 4%, E Sussex on 9%.
Kent, Dorset, and a number of cities are not reporting. I'll come back to this later.
2/8
The PCR positivity map is out.
Most areas are either not reporting or have stopped within the last 7 days, hence this week's national average is unlikely to have any meaning at all.
I'll discuss known hotspots first, then the data shortage issue.
https://t.co/1phcyp7jth
1/8
SARS-CoV-2 is one of the most studied pathogens in the history of medicine, especially given the relatively short timeframe where the bulk of research took place. The complex host-virus interactions leads to prolonged disease and sequelae affecting basically all body systems
Researchers say there's a big difference between people who think they’ve never had COVID and those who truly haven't. Data suggest only 2–3% of people worldwide may have avoided infection, with many unnoticed cases due to mild or asymptomatic illness.
https://t.co/KUh89qKETh