Tsla, pltr and nvdia investor. I use my homily charts for investing. Not financial advice. Tesla car owner, piano self learner. Don’t follow me as I’m stupid.
How to read my charts more accurately?
Box 1/Panel 1: Candle patterns
1. Red candle----a bullish signal, hinting that there is an uptrend in the shorter term.
2. Yellow candle---a bearish signal, implying that there is a downtrend in a shorter term.
3. Dark blue candle--the uptrend persists
4. Light blue candle---the downtrend persists
5. Red ribbon---uptrend in the middle term
6. Blue ribbon---downtrend in the middle term Even a red ribbon or blue ribbon has both red candles and yellow candles.
Box 2/Panel 2: Technical expert.
It is a mimic of Panel 1.
1. Green bar refers to bearish sentiment whereas red bar refers to bullish sentiment.
2. Purple line refers to the midterm uptrend line whereas the green line refers to the midterm downtrend line.
Box 3/Panel 3: Whale accumulation/distribution patterns vs Retail accumulation
1. Whales (red bars) need to reach 50 %for the stock to run and 75 % to surge.
2. Whales can both accumulate and distribute. The longer the red bars, the more the whales—a bullish trend
The shorter the red bars, the less the whales—less bullish, as whales might be shaking out weaker hands or distributing, depending on the price actions.
3. Retail investors (green bars). For a stock to run, green bars need to disappear. The longer the green bars, the more likely the stock is going to drop/plummet.
4 .When seeing a decrease in the percentage of retail accumulation over the past few days, weeks or months, it can also be a reliable signal that the stock is bottoming out.
5. Yellow bars are daily traders, which we don’t need to care.
Box 4/Panel 4: MACD (Moving Average Convergence Divergence)
1. When the MACD is below zero, the price is usually in a downward trend (bearish momentum)
2. When the MACD is above zero, the price is usually in an uptrend (bullish divergence)
3. The golden cross (fast and slow line crossing each other) curls to the upside, a bullish signal.
4. The golden cross curls to the downside, a bearish signal.
Box 5/Panel 5: RSI (Relative Strength Index)
1. RSI around 20-30 is oversold and it may be a buy indicator whereas RSI above 80-95 is usually a sell signal.
2. I like to use 3 sets of RSI and compare the previous lows as a signal to predict the bottom price. When 3 sets of RSI curl up, it’s usually bullish and vice versa.
For those of you who like to know more, you can just click the following video that Dr Cat @cryptocantoncat invited me to share.
https://t.co/WxdC9syzeD
or
https://t.co/ZQ6Yufd21M in which Matt @matthughes13 and I shared some tips on how to read my charts as well.
For those who would like to view more daily charts (at least 4-5 a day) with my (TA) technical analysis for free, you can join my patreon. For those who wish to view as many as 50 charts with my TA a day and understand more in depth, please subscribe it.
https://t.co/iB4xJha2Xd
PLTR is the next PLTR (August 29, 2026)
Amid retail fear and skepticism — with gurus calling $PLTR a bull trap and Elliott Wave analysts predicting a plunge to $60–$80 — I chose to buy more and accumulate aggressively over the past 5 months.
Here is a partial screenshot of more than 17,000 shares. Another 33,000 shares sit in a private bank joint account and are not shown. That is 50,000 new shares bought over the past few months during big discounts, on top of the aggressive initial position of 100,000 shares I opened at $8.80 back in 2023, plus further accumulation from 2024 to 2025 at prices ranging from $10 to $150 along the way.
I foreran almost every indicator before they turned bullish. Don’t tell me an indicator only flips bullish after $PLTR closes above $180. Call it luck if you want. I don't really care. But guts, conviction, and TA tell the real story.
Luckily, my community trusted my signals and followed the buy orders I highlighted on the daily chart from $110 through $135. We don’t need complicated moving averages, VWAP, Elliot Waves, or fancy tools. A simple, reliable setup is what produces the gains — if you trust the process and stay as patient as I do.
If you want to build real wealth, follow genuine and trustworthy people with a proven track record who are willing to post a simple screenshot. For the past three years I have not been bearish on the stock market for a single day, while most gurus flip-flop every week. That flip-flop mindset will never deliver financial freedom. It only adds noise and damages your portfolio. Had I listened to permabears, analysts, or the retail crowd, I would not have made millions in $PLTR alone. One stock. One modest size. One conviction. Life-changing gains!
I will keep sharing plenty of bullish setups with the community this week. If you unsubscribe or unfollow, no hard feelings—just find someone who works even harder and shares just as openly and genuinely. Good luck out there!
@sheslee@cantonmeow@matthughes13@HeidingOut@redfoxryder@chad_ventures@gabz_investing@starship_ride@Hiteshp99@tonylee80@niker8202
Over the past few weeks, I’ve shared my $PLTR buy orders with my Tier 3 community and highlighted all the bullish signals in my daily and weekly “MUST-READ” posts—available to Tiers 1-3 and X subscription.
Transparency is everything!
Sorry, I am not a financial advisor and have never been qualified to give financial advice. For any financial guidance, it is far better to seek professional advice from those working at prestigious banks who earn US$2-$5 million per year.
I simply share my charts, my insights, and my technical analysis (TA). I never ask anyone to buy or sell, and I never promise that anyone will retire rich from following what I post.
Investment is a deeply personal matter. You do not need anyone’s approval or consensus. The more voices you listen to, the more confused you often become.
Trust only yourself on your investment journey.
Know what you own. Do your own research, develop your own process, manage your own risk, and take full ownership of every decision. And the most important thing: stay away from permabears if you wish to succeed. That is the only sustainable way to navigate the markets over the long term!
More examples of how volatility holes along the descending blue ribbons helped our community time the bottoms: $IBIT, $PYPL, $HIMS, and $SPCX.
The pattern is consistent. Once you recognize it, you can get ready for the discounts, size up with conviction, and stay patient through the first bounce.
I’ll keep highlighting these setups in my daily and weekend posts — so my community can spot them as they form.
When the next volatility hole appears along the descending blue ribbons, buy, accumulate, and size up for the first two to three days. Then sit tight and let the whales do the rest.
Simple. Effective. Reliable.
@cantonmeow@tonylee80@sheslee
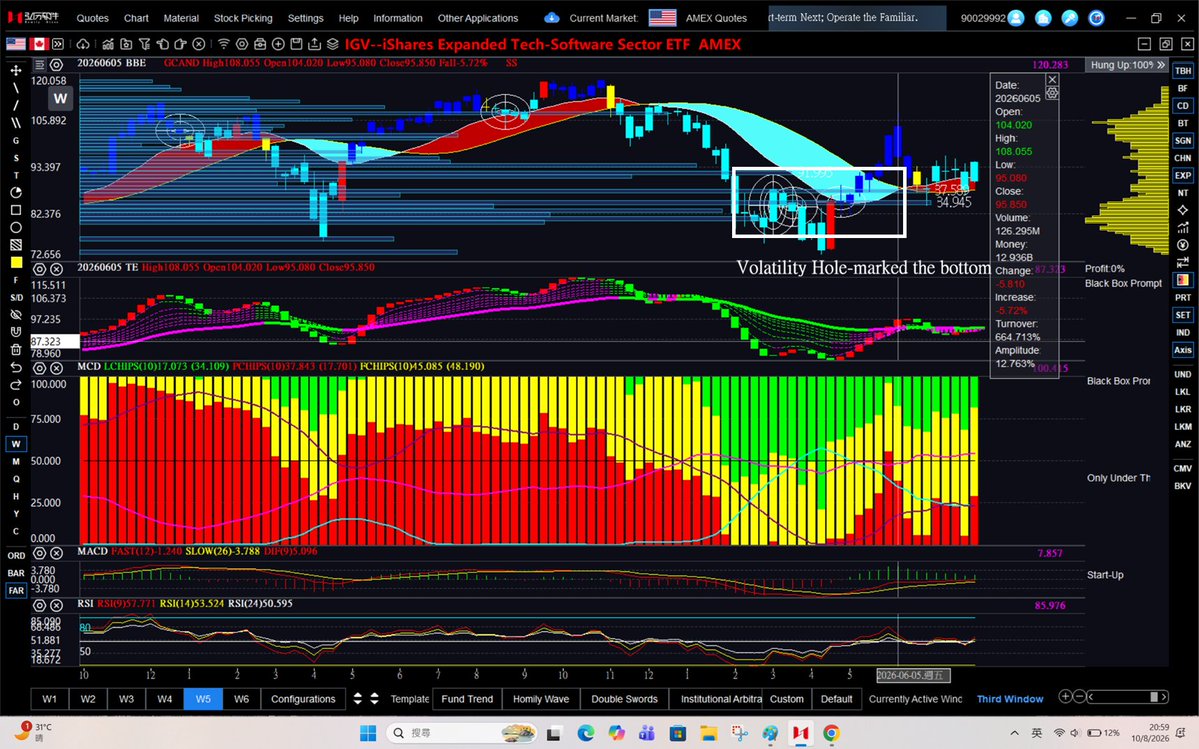
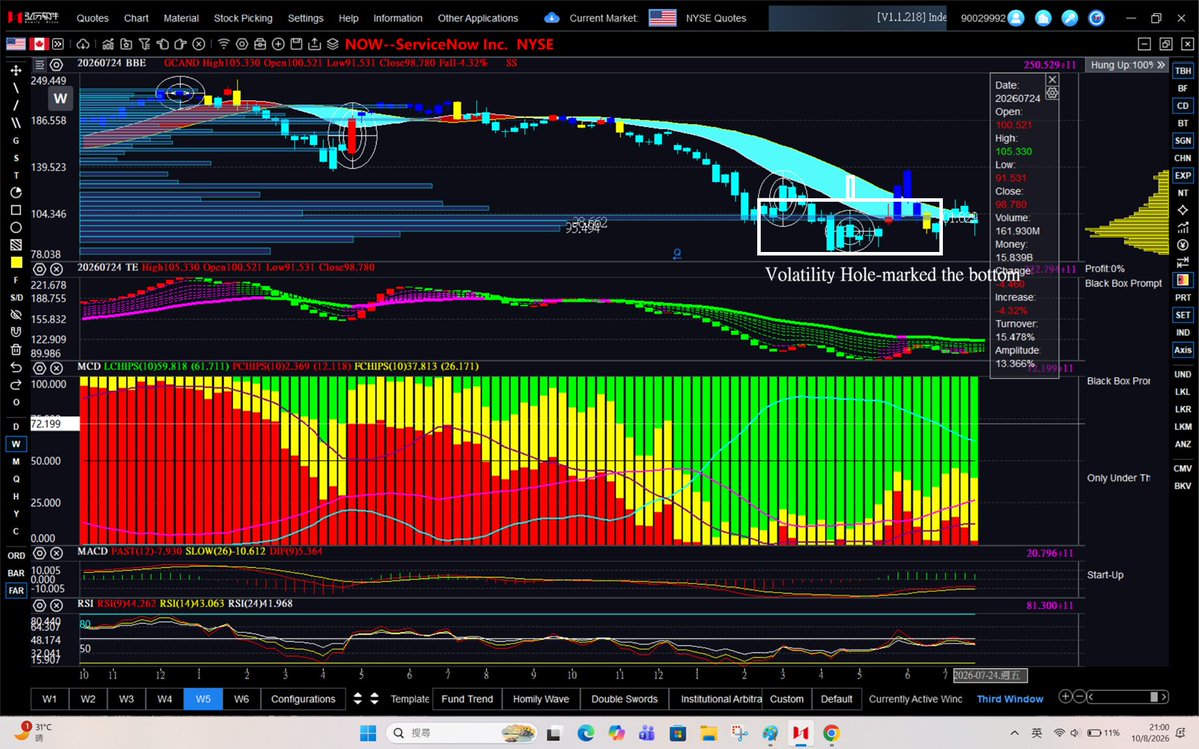
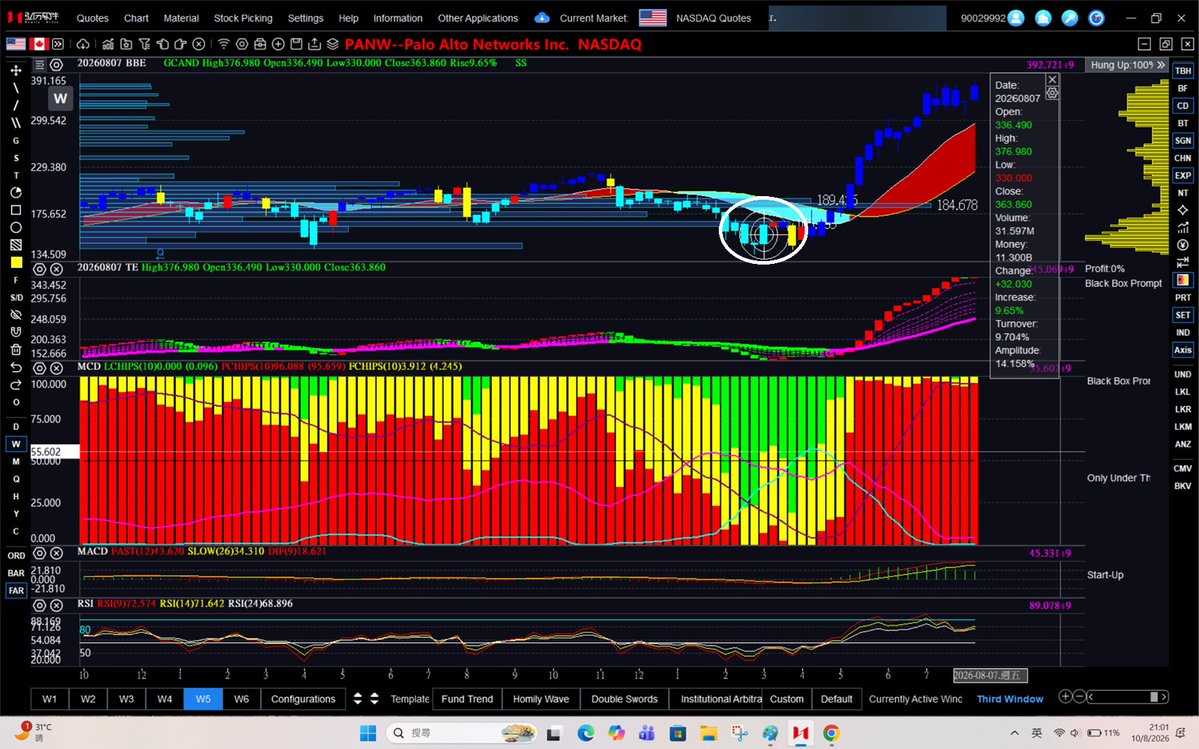
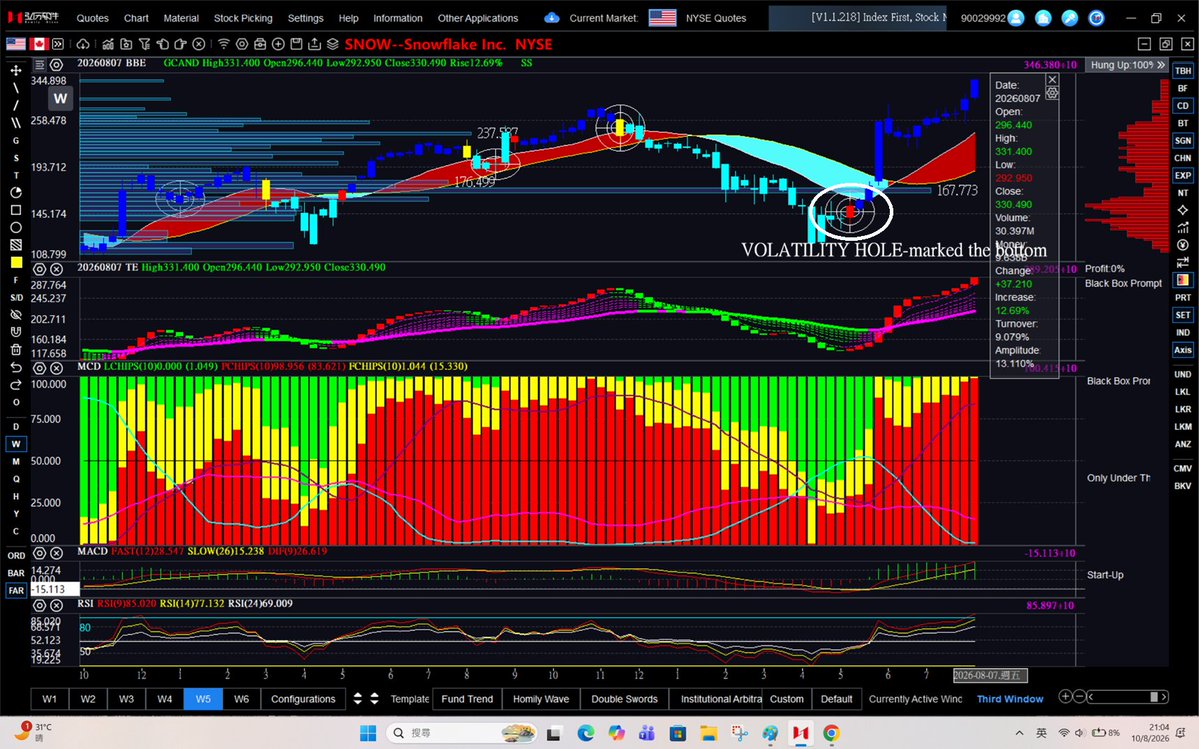
My favorite and most accurate indicator is the combination of a volatility hole with the descending blue ribbon. This setup is especially effective for identifying the early stages of a bottoming process.
The following four examples highlight its accuracy:
1. $IGV – A volatility hole appeared in the week of March 20, when the stock was trading between $80 and $87. It is currently trading around $102.69.
2. $NOW – A volatility hole appeared in the week of April 24, when the stock was trading between $83 and $90. It is currently trading around $124.88.
3. $PANW – A volatility hole appeared in the week of March 6, when the stock was trading between $146 and $165. It is currently trading around $363.86.
4. $SNOW – A volatility hole appeared in the week of May 8, when the stock was trading between $136 and $157. It is currently trading around $330.49.
I personally prefer weekly charts because they tend to be more reliable and sustainable. This indicator usually takes 4–5 months to fully unfold into the subsequent uptrend.
Patience is the key—especially if you trust these signals and are a genuine long-term investor!
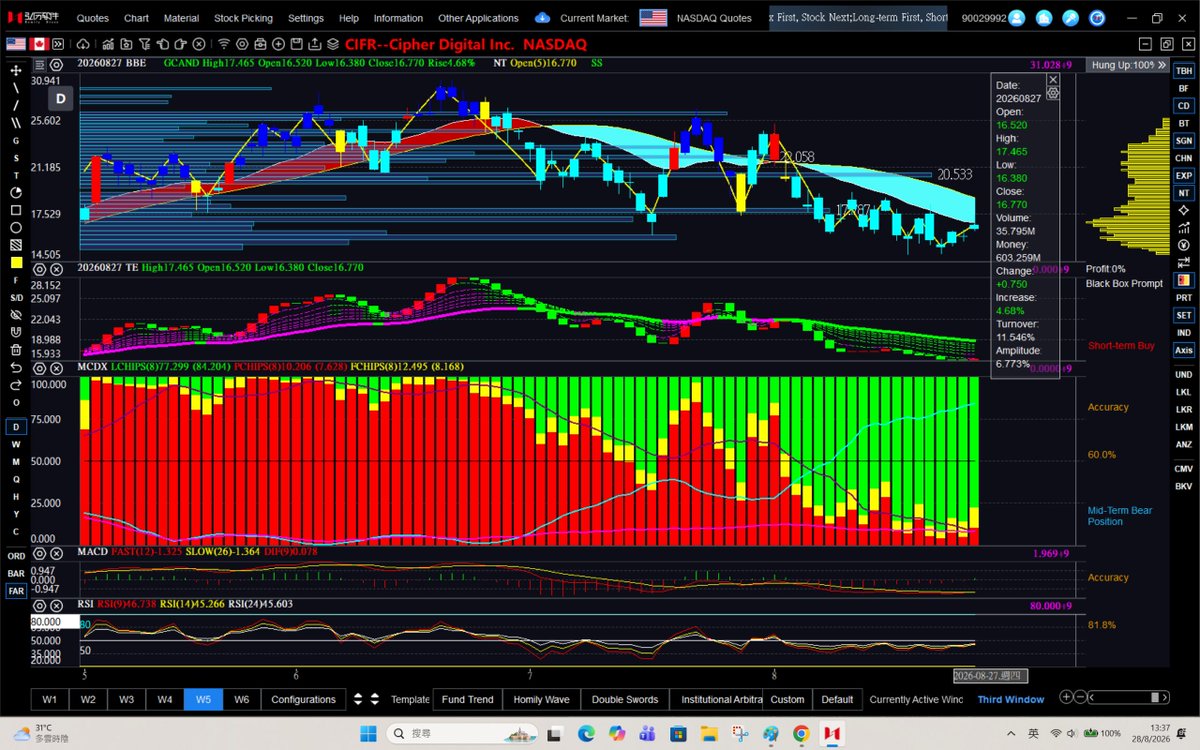
$NOW (August 27, 2026-Weekly Chart)
It was not the red candle I followed, but the volatility hole — an indicator I consider 10x more powerful. It has helped me identify the bottom in most stocks, and $NOW was no exception.
The last volatility hole accurately marked the low, and I shared it with the community at the time. Since then, momentum has begun to build, even if the path has been choppy. We do not care about the noise. Our community last loaded up in the $90 range. We bought, waited for the pullback, and the longer-term investors continued adding.
Now, we simply hold through the cycle rather than trade in and out. Congratulations again to everyone who trusted the bottoming signals. Today $NOW is breaking out of the critical $129 level. The next level to watch is $139.20
$CRM (August 28, 2026-Daily Chart)
How to use the signals to buy and accumulate?
1. The last volatility hole marked the bottom. Treat it as the buy zone and the aggressive accumulation zone.
2. Buy on the trend-reversal candle, when the blue ribbon (downtrend) flips to the red ribbon (uptrend).
3. Buy and accumulate on each red candle when whale accumulation is steady.
4. Buy when the highlighted momentum bars close above, with steady whale accumulation in panel 3.
Hold tight. Do not trade in and out. Wait for the next yellow candle on the weekly or monthly chart to trim or sell.
I am not in the market to chase small money with constant trading. In more than twenty years around genuinely wealthy people in finance, I have seldom seen anyone become a multi-millionaire that way. It happens of course. But it doesn't happen or wont' happen to the majority!
One of the most common mindsets is the belief that the more you trade, the more money you will make. The investors who actually create the most wealth do something far simpler: they identify the right sectors to invest, keep dollar-cost averaging into the right stocks during every drawdown and in bear markets and then hold for a decade or longer. That is exactly how most early investors in the big tech companies built their fortunes. No shortcut!
Trading can definitely be fun and exciting when it works. Lasting wealth, however, is not created through frequent trading. My experience and track record speak for themselves!
Just finished today’s charting of 60 stocks. 19 are showing bullish signals — details in the following post.
https://t.co/Lwbio0EbEr
Feel free to take a look if you’re interested. I also put together a Sunday bullish list of 15 stocks — link below.
https://t.co/fLwaKTV17o
Stock picking matters more than any indicator in the world.
If you never learn how to evaluate a company, every indicator is totally useless!
Before I look at a chart, I study the business and pick the leaders that capture all of the following:
1. Year-over-year quarterly EPS growth
2. Management guidance
3. The CEO’s personality, charisma, and long-term vision
4. The company’s competitive moat
5. Institutional (“whale”) accumulation. I have regular meetings with fund managers and directors to stay close to what institutions are actually doing.
In short, the business always comes first. Charts come next!
@cantonmeow@tonylee80@sheslee@niker8202@Hiteshp99@gabz_investing@redfoxryder@starship_ride@HeidingOut@RosannaInvests
$CRM (August 28, 2026-Daily Chart)
How to use the signals to buy and accumulate?
1. The last volatility hole marked the bottom. Treat it as the buy zone and the aggressive accumulation zone.
2. Buy on the trend-reversal candle, when the blue ribbon (downtrend) flips to the red ribbon (uptrend).
3. Buy and accumulate on each red candle when whale accumulation is steady.
4. Buy when the highlighted momentum bars close above, with steady whale accumulation in panel 3.
Hold tight. Do not trade in and out. Wait for the next yellow candle on the weekly or monthly chart to trim or sell.
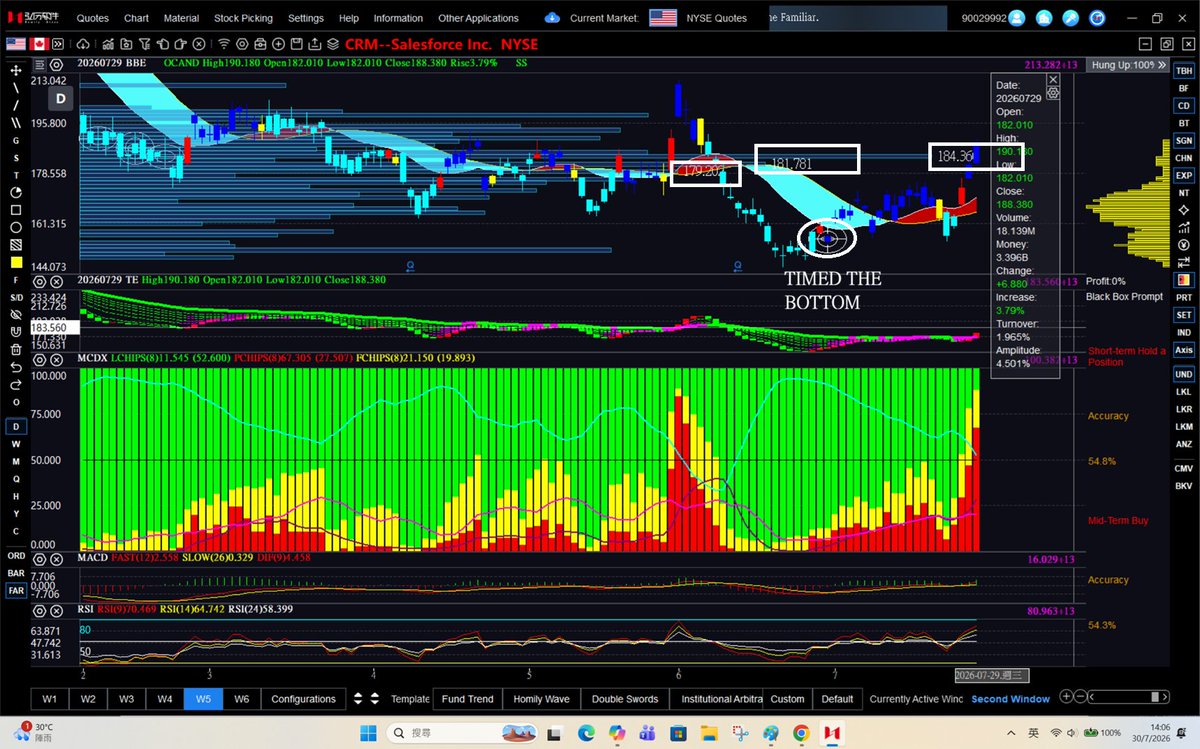
$CRM (July 30, 2026-Daily Chart Update)
The last volatility hole marked the bottom for $CRM in the $150–$160 zone. Since then, momentum has steadily built as the price cleared successive critical momentum bars at $179, $181, and $184—turning each into solid support. Key resistance now sits at $198 and $210 respectively.