Due to the widespread adoption of LLMs, the DataVizMed project is no longer needed.
If you have any specific questions, please feel free to contact, but please note that this project has been discontinued as of 2025.
domain name will be downgraded to:
https://t.co/O7Tu9M5er9
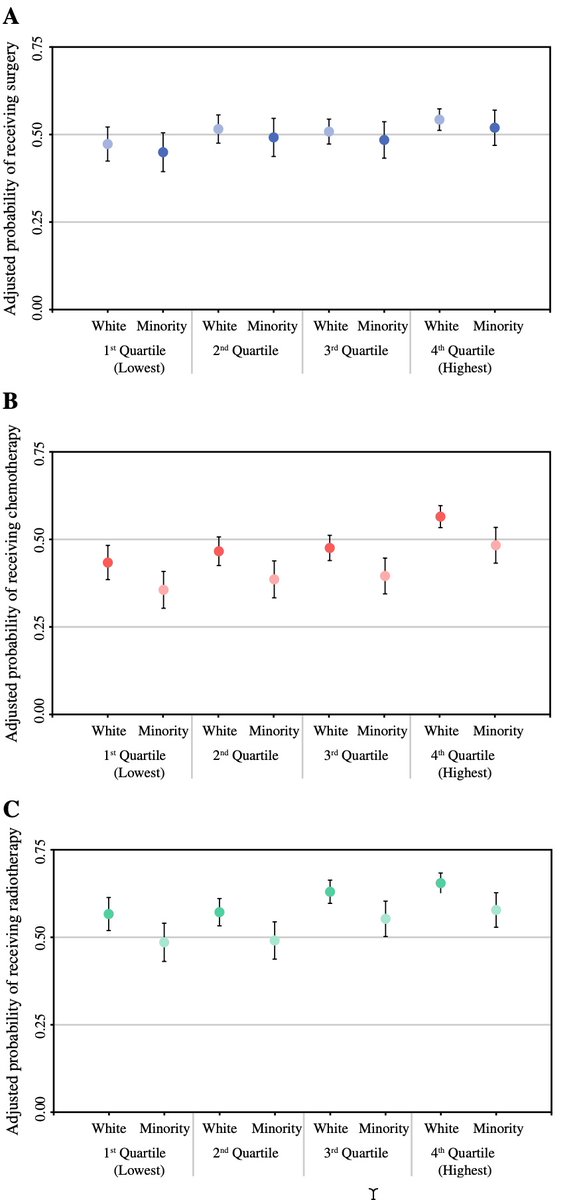
w13: Original vs. Replica
Cox, Median survival, and Bar plots
sharing #rstats experiences via the replication of published articles #dataviz#datavizmed
https://t.co/yWregfphY9
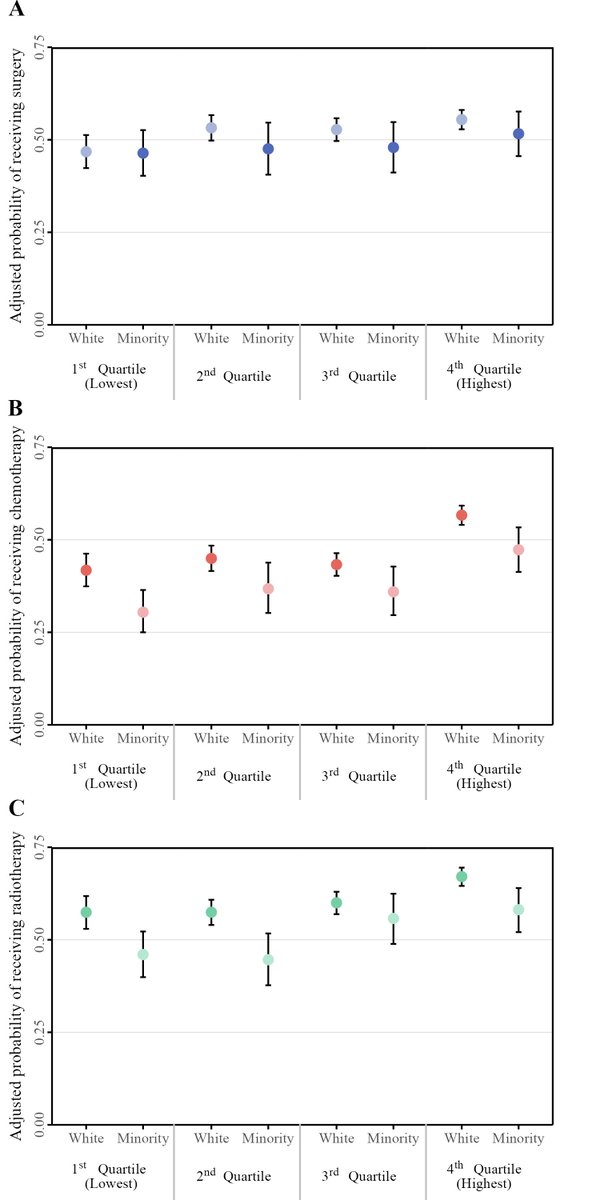
w12: Original vs. Replica
error bars for % and CIs,
faceted plots
sharing #rstats experiences via the replication of published articles
#dataviz#datavizmed
🔗website + github page: https://t.co/kPD6E0XjXg
@JulienMouchnino@R_Graph_Gallery@DavidGohel totally different approach, but sure it is possible.
My way:
* use #tidyverse to summary
* use #flextable to modify the table
Here is the code (surely seems more complex, but fully customizable, and provides .docx output)
https://t.co/8tjPuTzqo4
and here is my version:
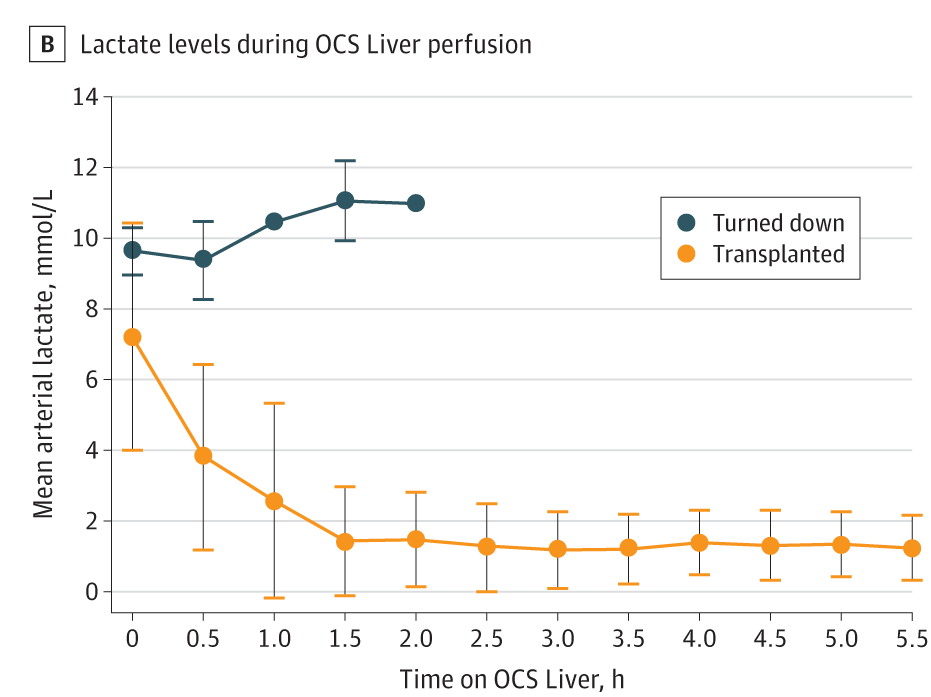
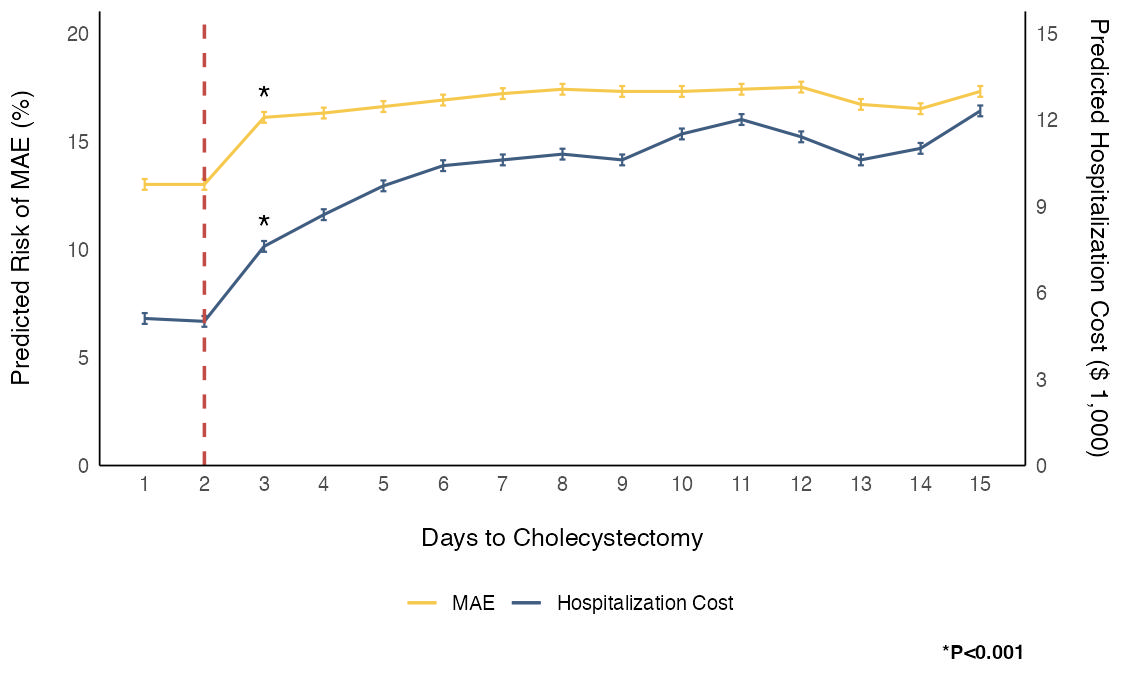
Week-10: Original vs. Replica
dual y-axis line plot.
sharing #rstats experiences via the replication of published articles (source: @SurgJournal)
#dataviz#datavizmed
🔗website + github page: https://t.co/8hlgjGUXCo
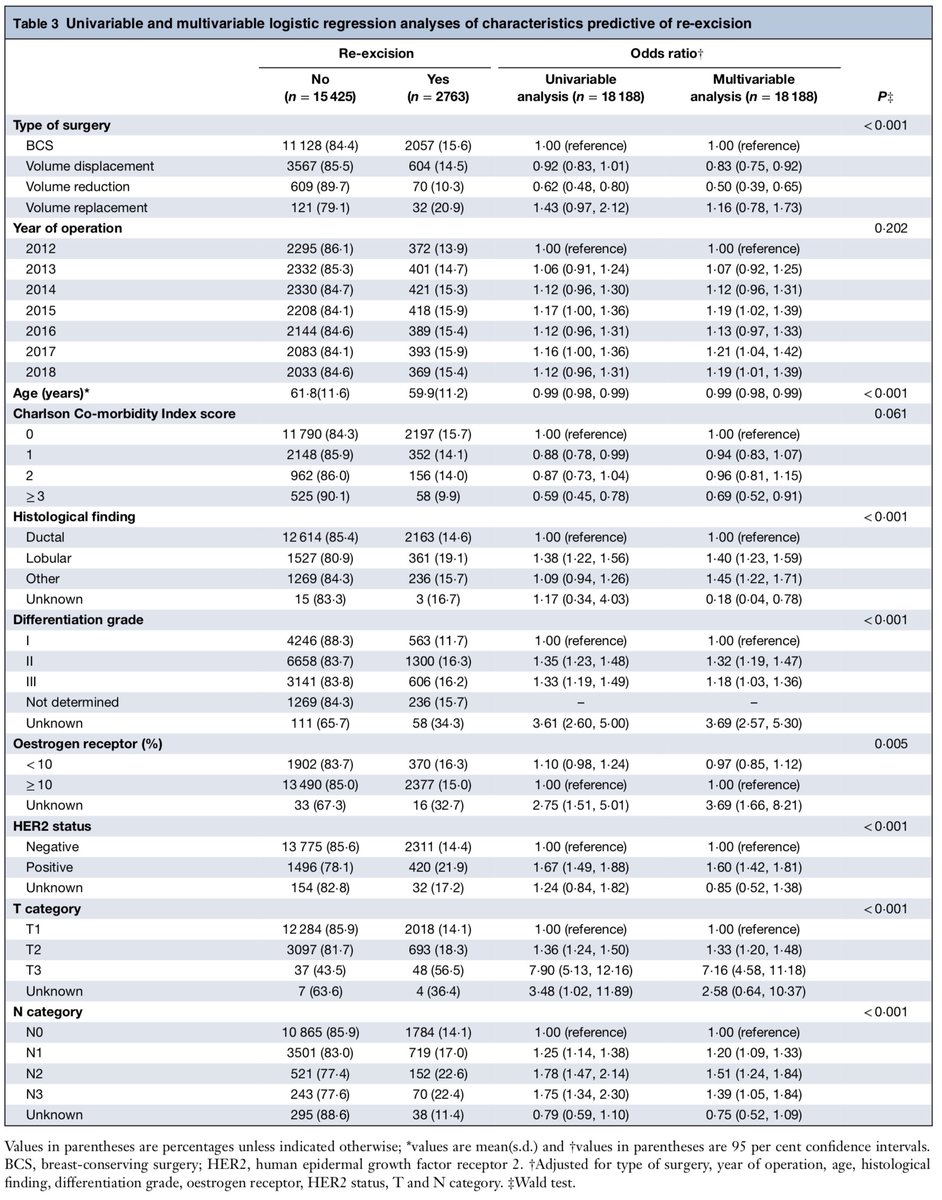
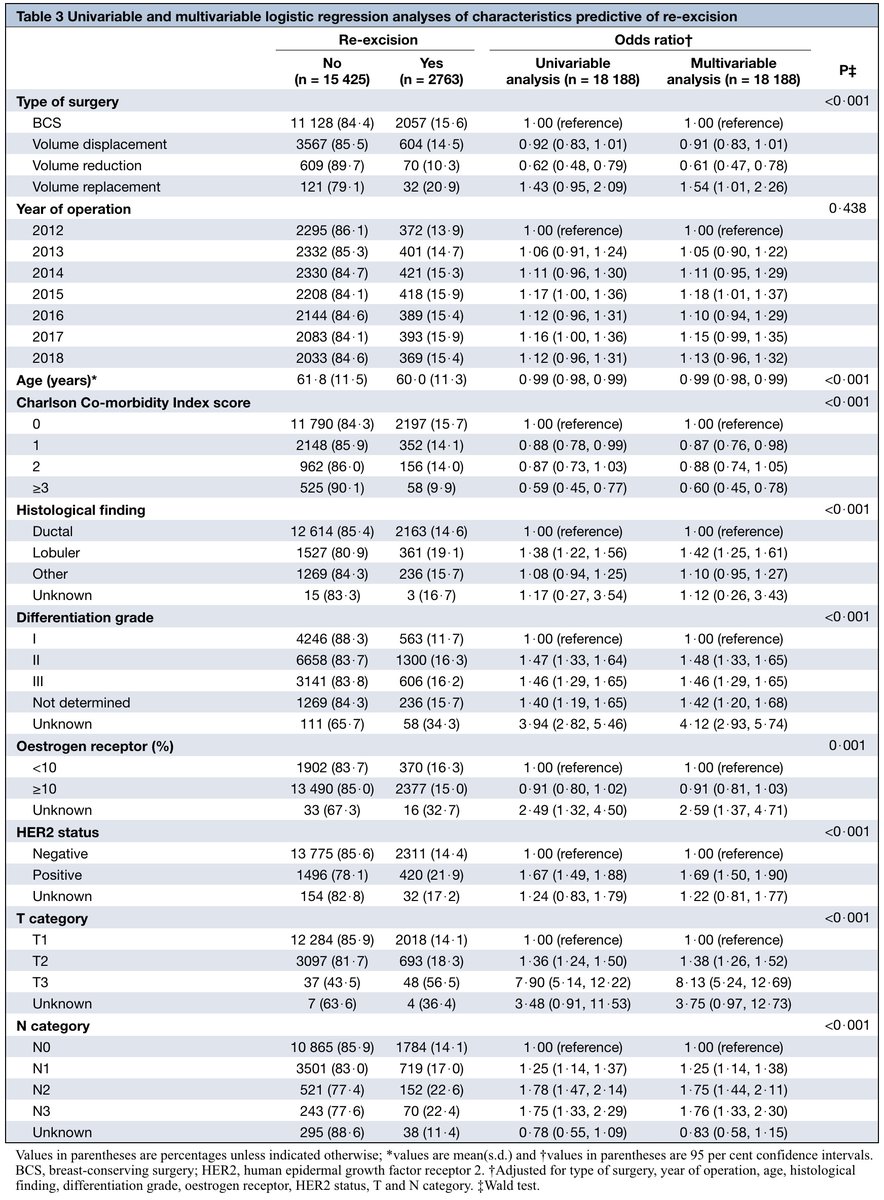
Week-9: Original vs. Replica
Regression table (UV and MV analysis) with the combination of #finalfit and #flextable.
sharing #rstats experiences via the replication of published articles.
#dataviz#datavizmed
🔗website + github page: https://t.co/yvdesFvgH1
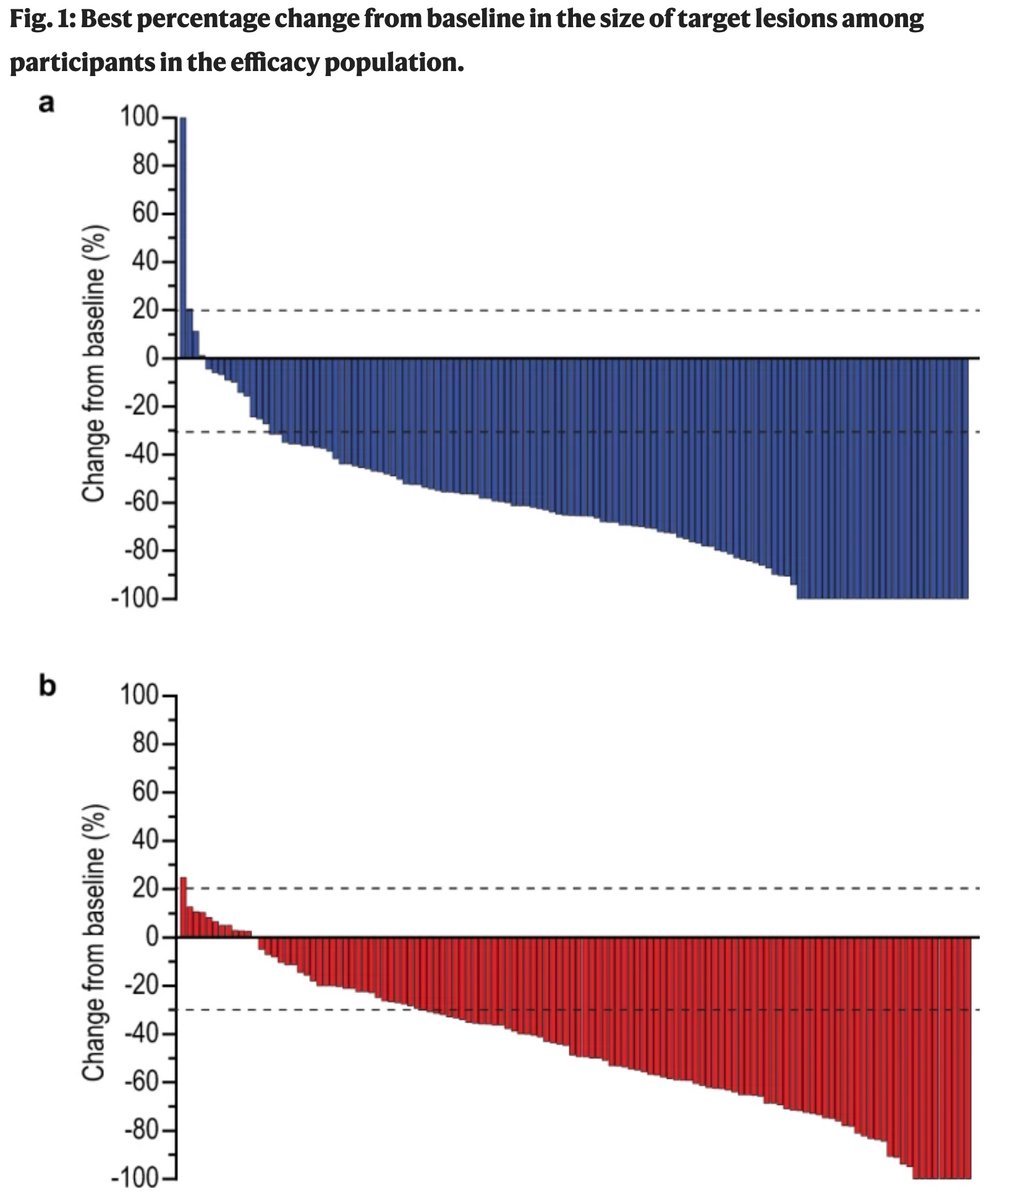
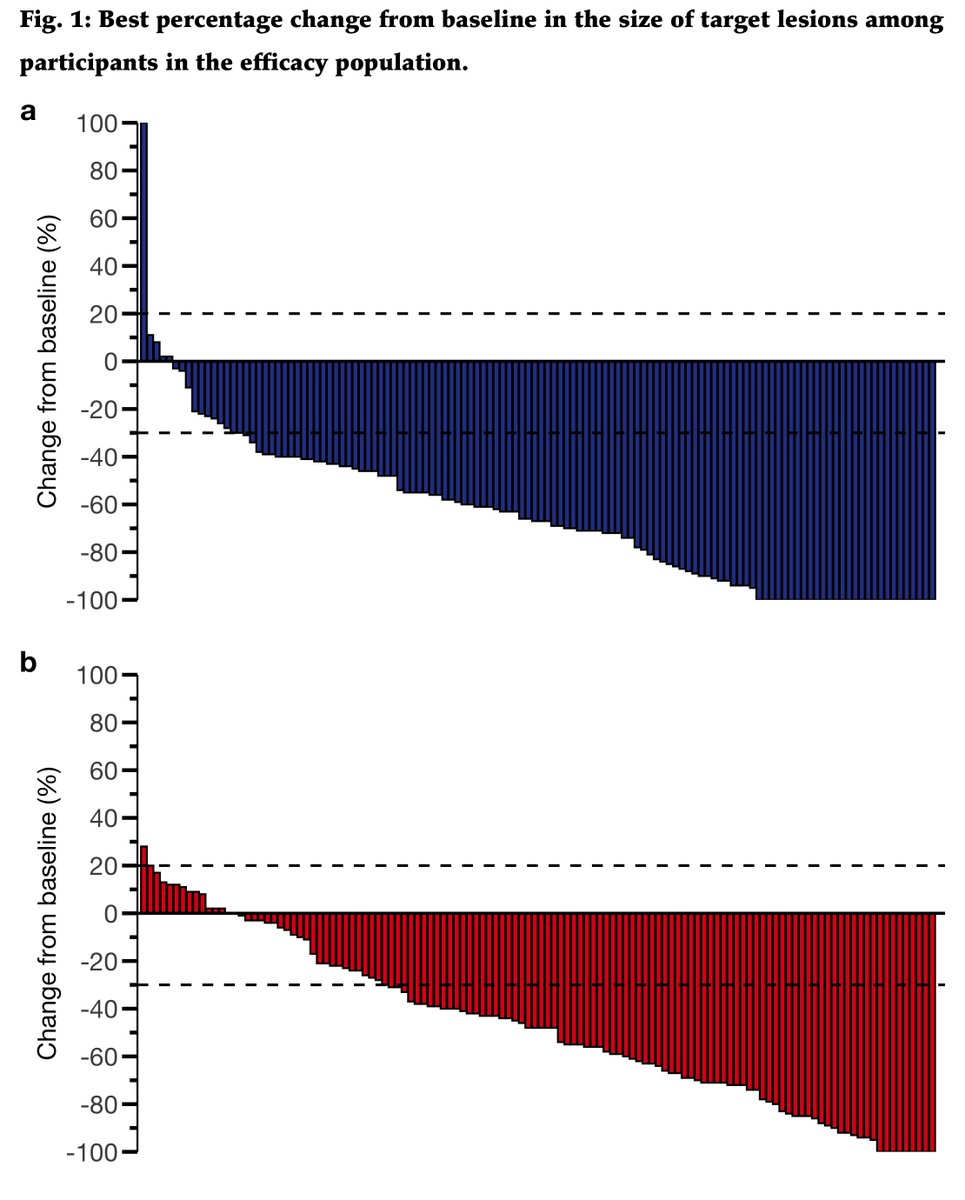
Week-8: Original vs. Replica
multiple barplots to show individual numeric values.
sharing #rstats experiences via the replication of published articles.
#dataviz#datavizmed
🔗github: https://t.co/4E3ndcnAgz
🔗website: https://t.co/LCy0wnMPOL
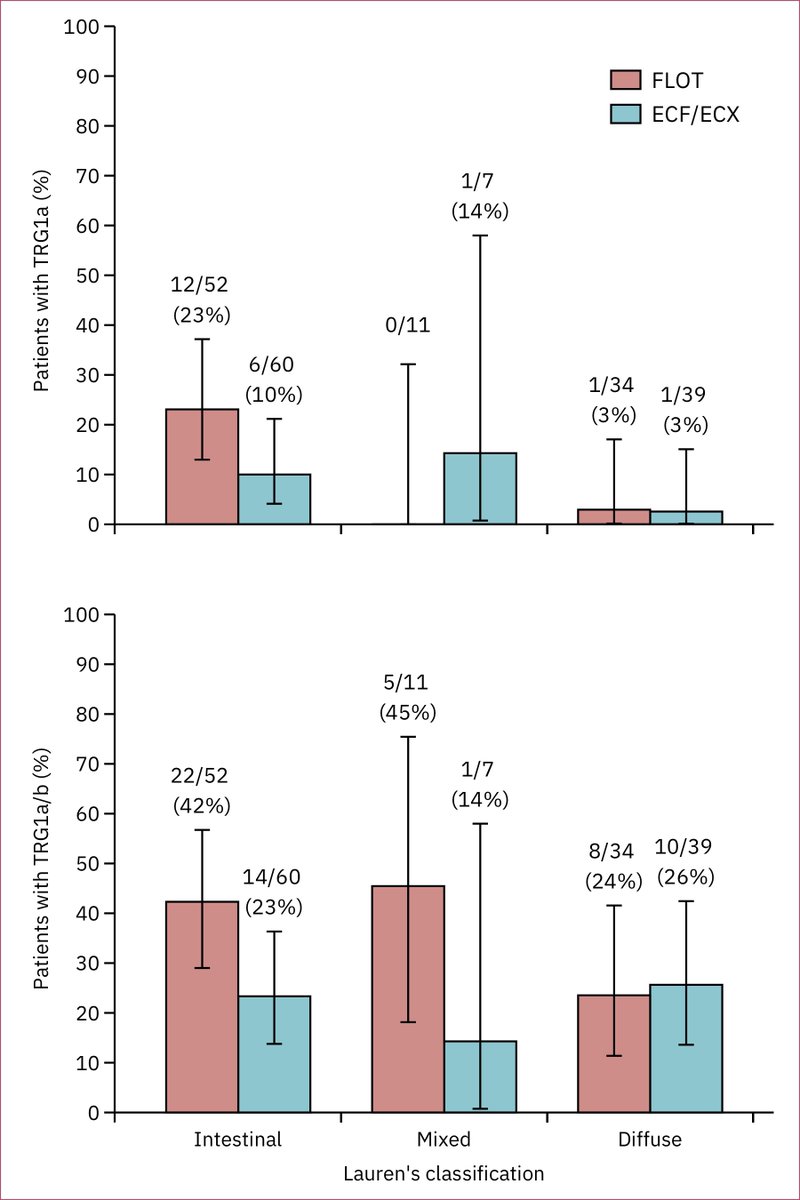
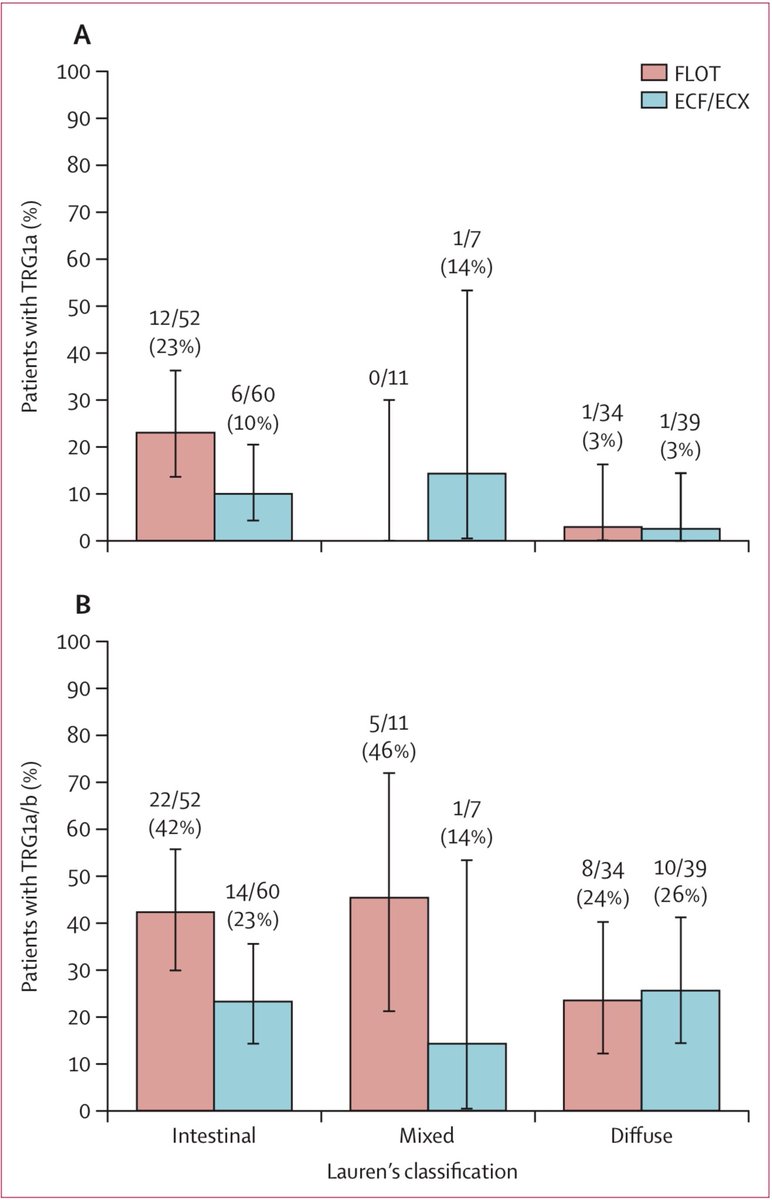
Week-7: Original vs. Replica
bar-plot with errorbars of CIs for proportions.
sharing #rstats experiences via the replication of published articles.
#dataviz#datavizmed
website: https://t.co/uzv4cvHLP7
github: https://t.co/8IDUMnPGwE
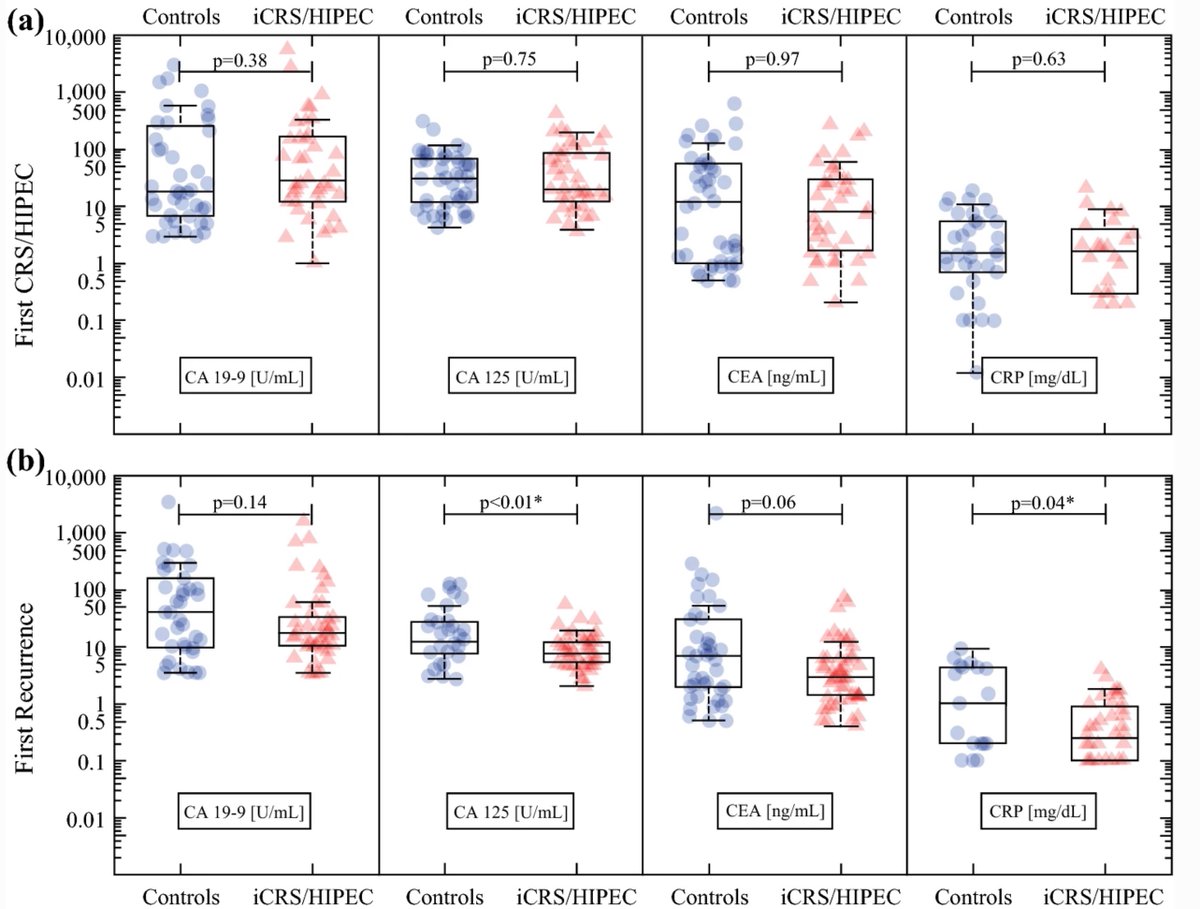
Week-6: Original vs. Replica
box-plot with jittered points for log-scaled distribution
sharing #rstats experiences via the replication of published articles.
#dataviz#datavizmed
website: https://t.co/aeGMaIaQ9s
github: https://t.co/kcGyuollra
@NEJM Congrats to authors and editorial team of @NEJM.
I believe, the study deserves better #dataviz. Very difficult to follow the presented data, especially for experimental groups.
And please do not crop the original figure without x-axis's name.
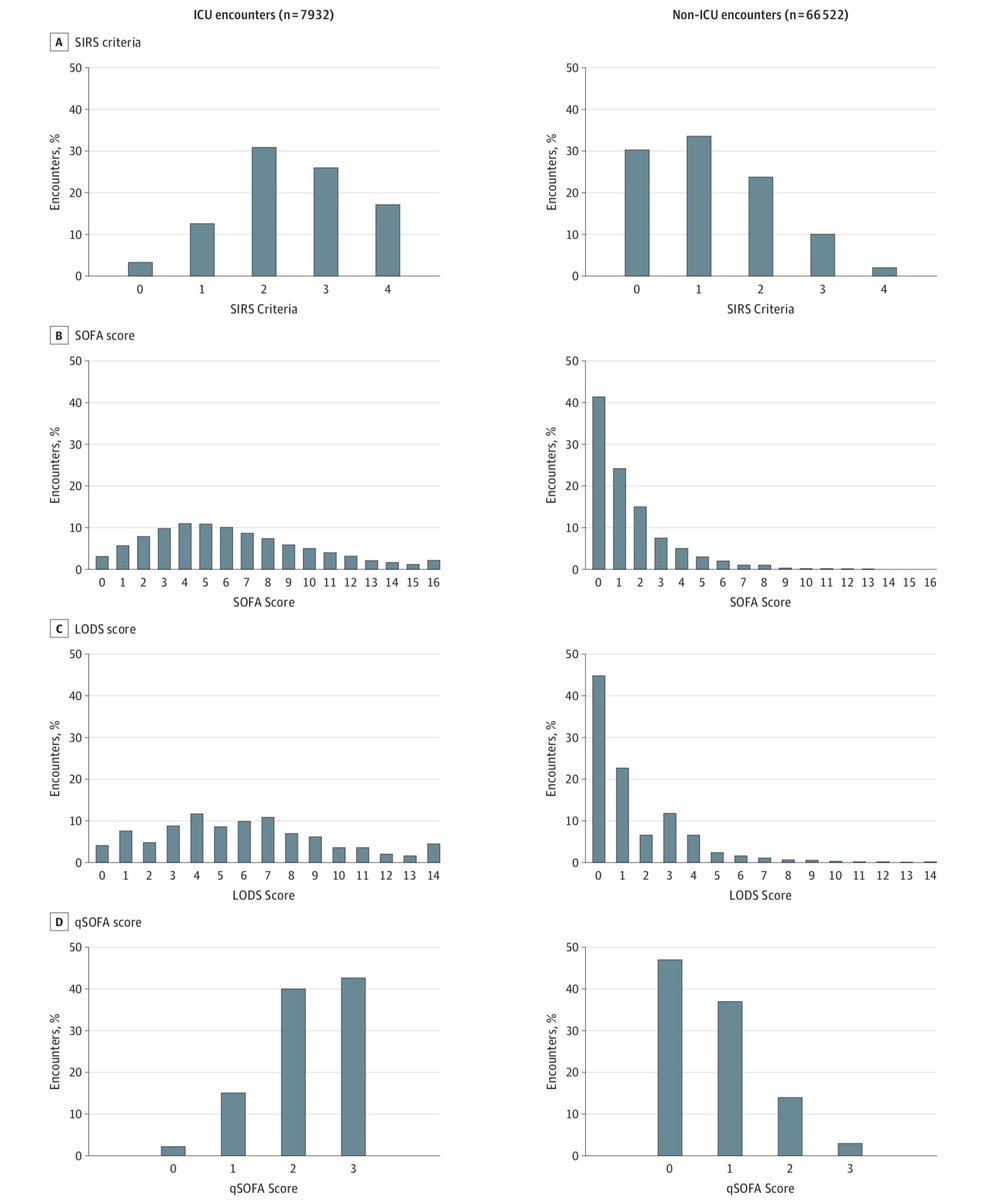
Week-5: Original vs. Replica
a flow diagram
sharing #rstats experiences via the replication of published articles.
#dataviz#datavizmed
website: https://t.co/OZ2LwNQzwH
github: https://t.co/DItuRVDPGe
Study found, in pts w diabetes & inadequate glycemic control despite use of insulin glargine, addition of subcutaneous tirzepatide, vs placebo, to titrated insulin glargine resulted in statistically significant improvements in glycemic control after 40 wk. https://t.co/LlO1c0GpRr
Week-4: Original vs. Replica
tables with #finalfit and #flextable (+#ftExtra)
sharing #rstats experiences via the replication of published articles.
#dataviz#datavizmed
website: https://t.co/cp6Ej7cWaf
github: https://t.co/Et6Abn06O1
Week-3: Original vs. Replica
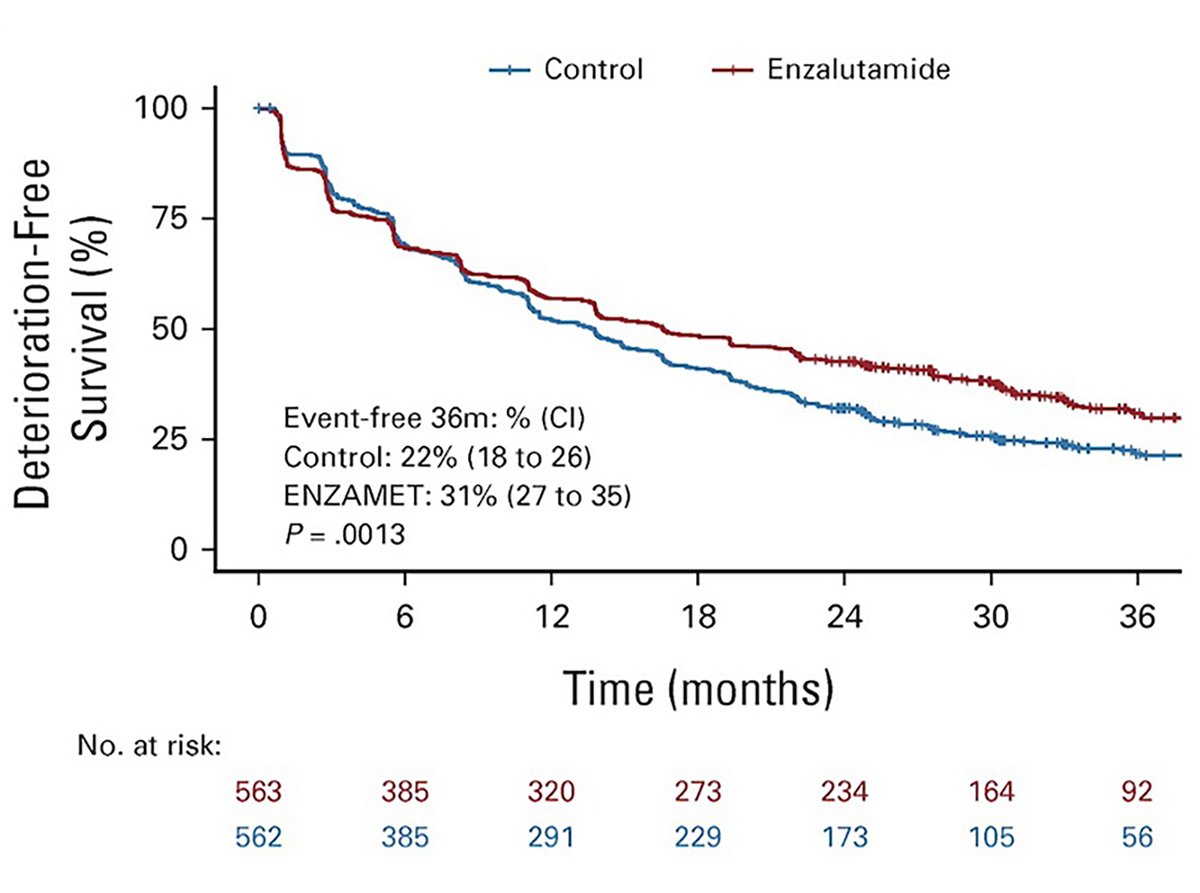
survival curves with #survminer
sharing #rstats experiences via the replication of published articles.
#dataviz#datavizmed
https://t.co/4C6pYosFyG
code: https://t.co/sBUUA1Val5
Week-2: Original vs. Replica
sharing #rstats experiences via the replication of published articles.
#dataviz#datavizmed
https://t.co/NamwMyZlhf
code: https://t.co/Y6DnrNmp77
Original vs. Replica
sharing #rstats experiences via the replication of published articles.
#dataviz#datavizmed
https://t.co/n34jN9WmAB
code: https://t.co/xttlBootEU