As someone who was brought up with the old BBC Micro computers in the 1980s, these micro:bits look very exciting! #PrimarySchools, you have until 18 December 2023 to register for your free pack of micro:bits. Visit https://t.co/u1EKMx0SJN
Get a comprehensive summary of the behaviour in your school.
By using School Analytics to analyze data, schools can gain valuable insights that can be used to improve pupil performance and make data-driven decisions.
More at https://t.co/gcqdTsFjsM
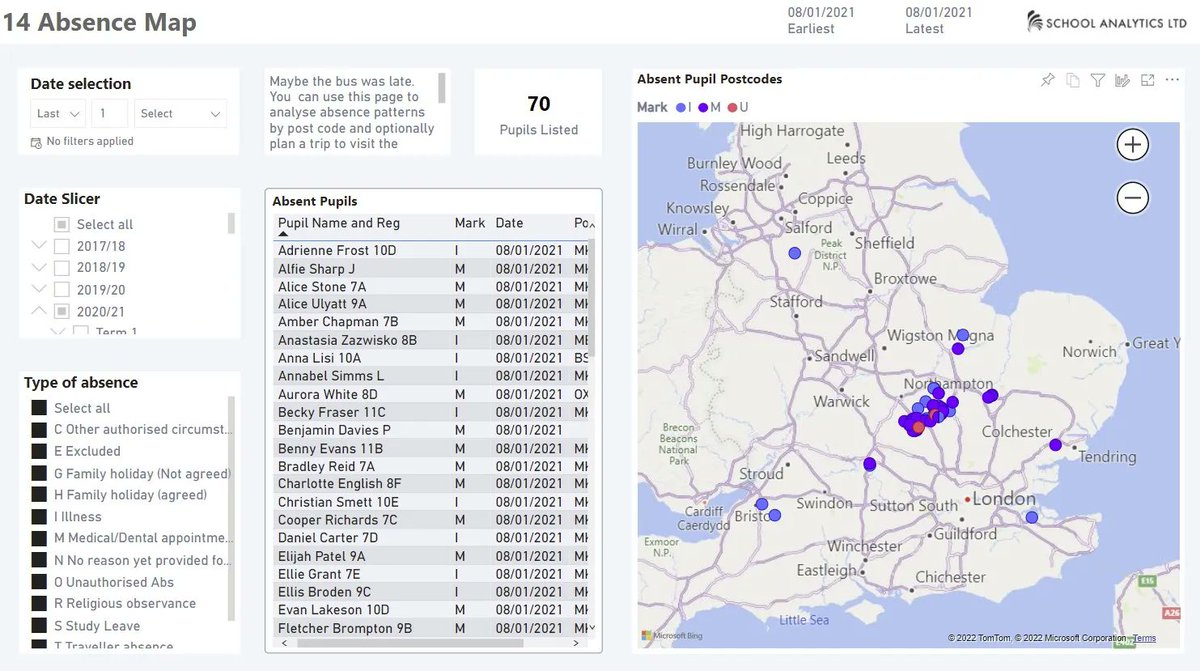
Know exactly which pupils are off school today, see where they live and why they are off school.
School Analytics uses Power BI to provide deeper understanding of the drivers behind school attendance.
More info at https://t.co/gcqdTsFjsM
Understand exactly why your pupils are absent from school. This is a heatmap marks analysis using School Analytics. More details here https://t.co/gcqdTsFjsM
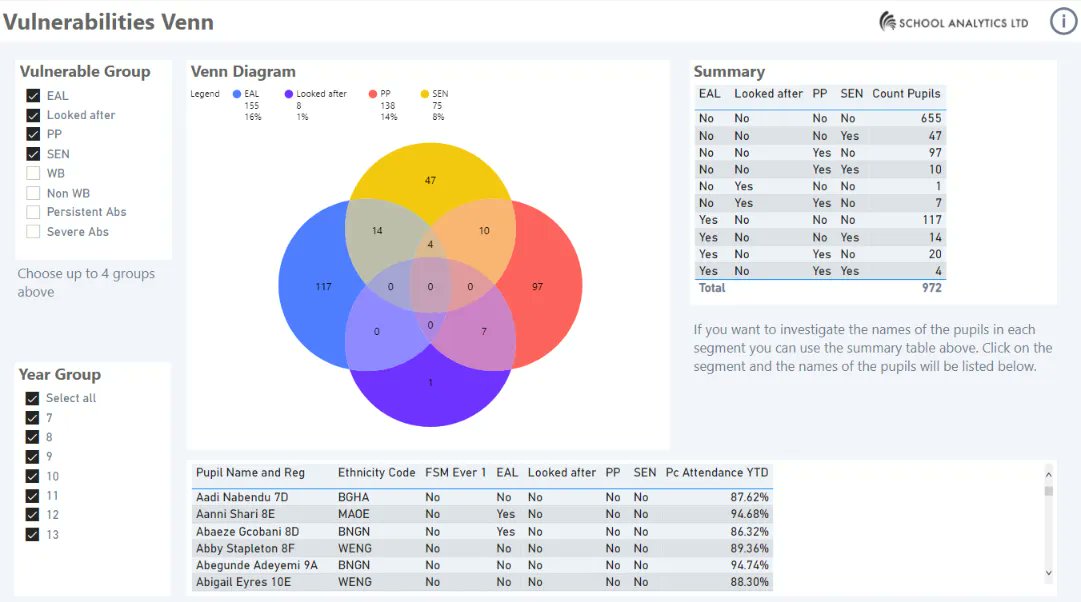
EAL and PP and SEN? Understand which pupils have multiple vulnerabilities with School Analytics. More info: https://t.co/gcqdTsFjsM #powerbi#schooldata#data#analysis#school
We often calculate the percentage of our pupils who are EAL, PP or SEN - but we seldom understand which pupils perhaps have multiple vulnerabilities. With a Venn diagram it is easy to discover which pupils have multiple issues. More at
https://t.co/6X3GeozF1Q #schooldata
When we look at PP, EAL and SEN groups in schools, for attendance or for attainment, it is often useful to compare them with the 'Non' group - non EAL, non PP and non SEN. I've just added these groups to the 'Attendance by Groups' page in School Analytics. #dataviz#schooldata
Which pupils have more than 10 unauthorised absences or lates this year? School Analytics uses Power BI to list the names of pupils and show you the long term trend. More details at https://t.co/2kiZW7TWP1
Using Power BI to create analyses for MATs is tricky - summarising data across several schools, some of them using different MIS systems takes a lot of different skills. But the end result can be worth it. See https://t.co/ztepUElHt1 for more.#PowerBI
Here's another attendance analysis that uses Power BI - this one identifies persistent absentees over a flexible period of time. Created to help a school who wanted to identify the pupils whose attendance over the last month had dropped below 90%. More at https://t.co/2kiZW7TWP1
Here's an example of an absence marks timeline that I created for school that wanted to understand why their pupils were absent. The timeline shows how many absence marks were recorded any type of absence. More details at https://t.co/2kiZW7TWP1
Power BI groups allow you to group together categorical data (eg pupil behaviours) into category groups (eg severe, moderate, trivial). But the feature is well hidden and the user interface isn't the simplest to understand. #PowerBI
https://t.co/s5Akb5WFB1
🗼POST
Filtering with multiple fact tables - a couple of techniques for getting eg the attainment of persitent absentees or attendance of students getting 4 in maths
Power BI groups allow you to group together categorical data (eg pupil behaviours) into category groups (eg severe, moderate, trivial). But the feature is well hidden and the user interface isn't the simplest to understand. #PowerBI
https://t.co/s5Akb5WFB1
Here's an example of a heatmap in Power BI. School absence codes from the registers are are along the top, weeks and months down the side. It looks like a lot of people were on holiday (H) just before Christmas. More at https://t.co/tlx6gLwbU5 #school#data#powerbi
Here's an example of a heatmap in Power BI. School absence codes from the registers are are along the top, weeks and months down the side. It looks like a lot of people were on holiday (H) just before Christmas. More at https://t.co/tlx6gLwbU5 #school#data#powerbi
'Our school doesn't use SIMS, can we use Power BI?'
Yes! Power BI can be connected to Arbor, Bromcom and more. School Analytics is a Power BI template for your school. It works with SIMS and can also work with Arbor and Bromcom.
https://t.co/ztepUElHt1 for more details.