Want your audience to remember more than just the aesthetics of your visualizations? @mikevizneros and @lilachmanheim explain how to get people to remember the message: https://t.co/ePyqX7hJXw
So great to see this biography accepted by @wikipedia thanks to efforts of the @WikiWomenInRed crew, a group on a mission to improve the internet by working to highlight the contributions of so many talented women of the past & present, for the benefit of our future.
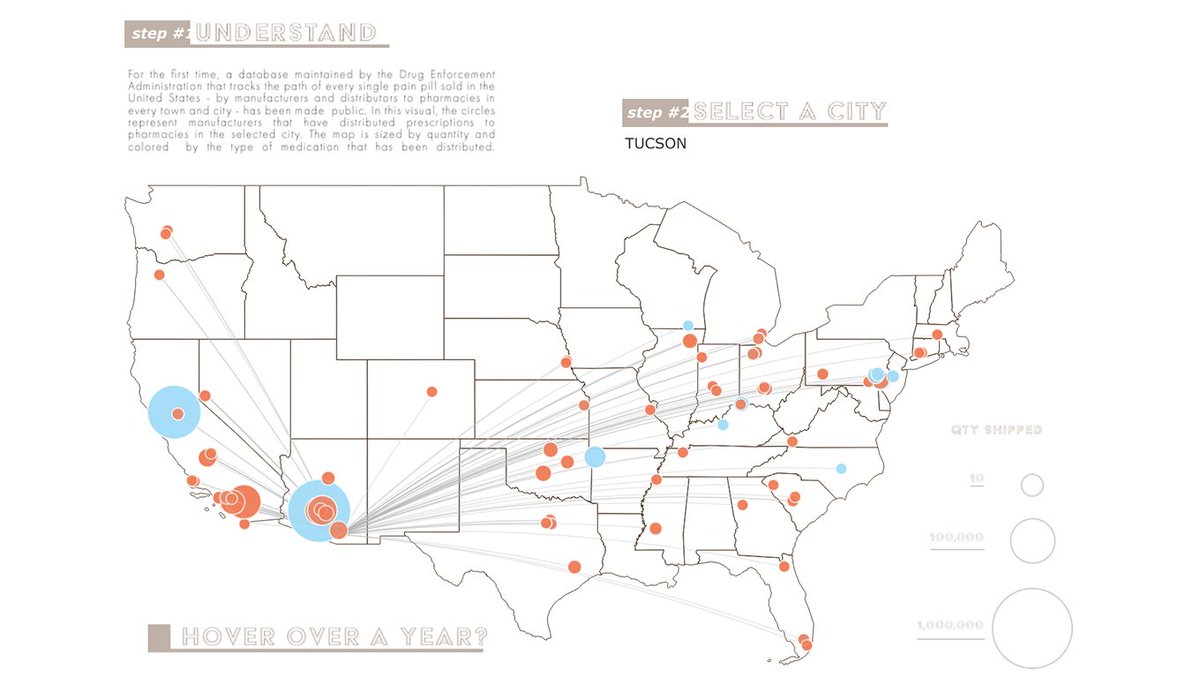
Which city in Arizona sells the highest number of pain pills per person? This #VOTD by @thecfelix shows the path of opiods into Arizona. Take a look: https://t.co/y7SHBLrnUd
Motion in #tableau. House of Representatives.
Thanks @kizley and @ZenDollData for sharing plum pudding chart creation and @FlerlageKev for his Catalogue where you can find any necessary chart
Works in @tableaupublic#dataviz
https://t.co/IyJQxLLCeh
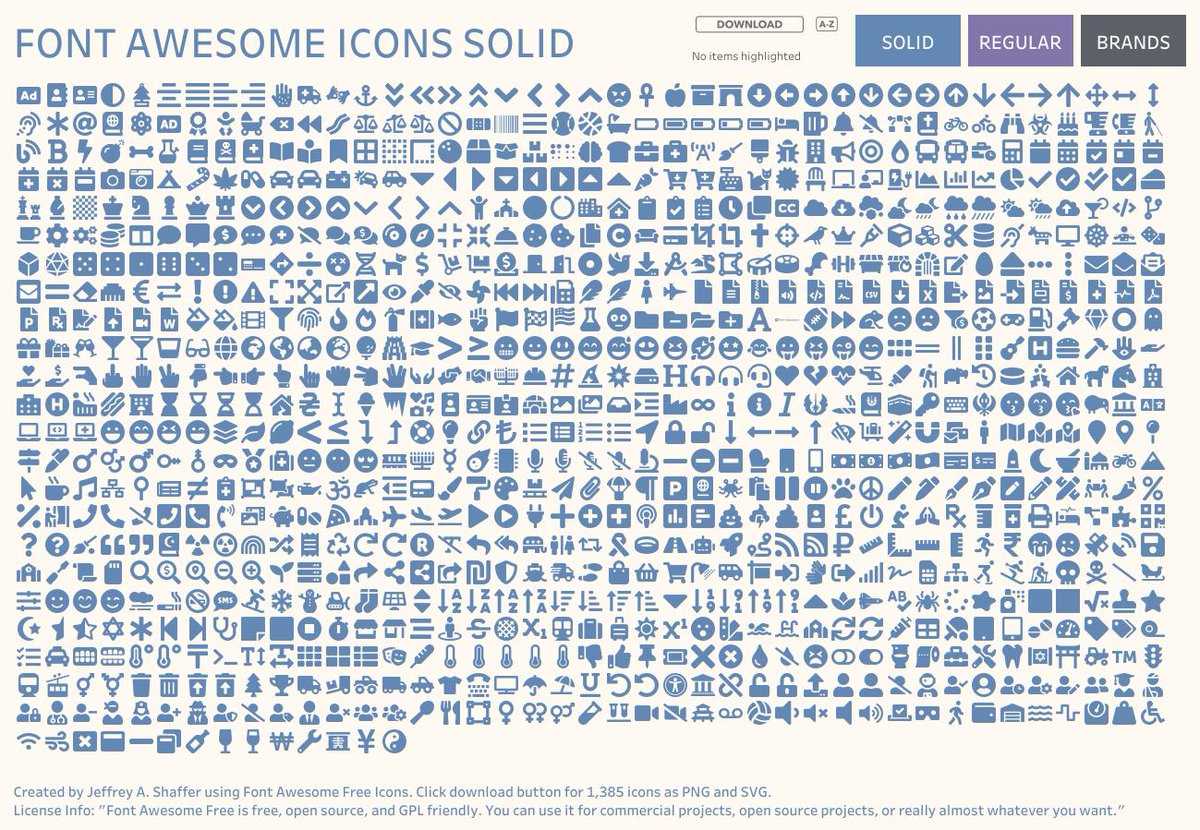
New Blog Post and Tableau workbook: Font Awesome Icons for Tableau. 1,385 Free Icons from Font Awesome organized in a Tableau workbook and available for download. https://t.co/9Y8pCgFeG7
Solving the puzzle of how to combine usability and beautiful design can be one of the most satisfying accomplishments for a creator. @lilachmanheim and @mikevizneros explain: https://t.co/V0tBTlqPGE