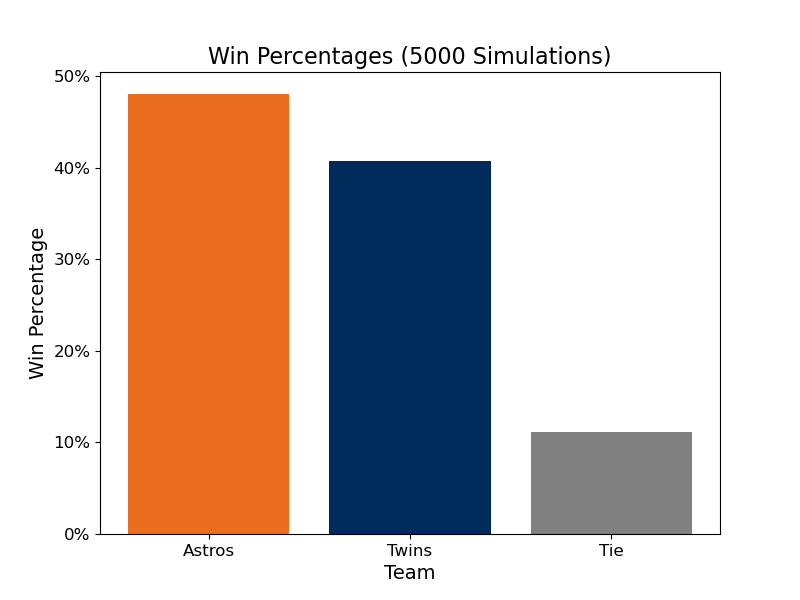
Wanted to put my MLB data statistical chops to the test and create an account that simulates previous game outcomes (including exit velo and launch angle) and compare it to what actually happened. Code is in my repo, which can be found in the account’s bio. Pls reach out with feedback!
@srbrown70 If it uses JAX then it might not matter? I haven’t tested nutpie and I probably wasn’t using pymc efficiently but I’ve found numpyro to be much faster (esp with @ JIT decorator)
@srbrown70 Right but seems like Shohei’s modeled dist doesn’t follow his underlying pattern and is heavily influenced by the league dist. Or is the “modeled” dist the league dist and Shohei is just there for reference?
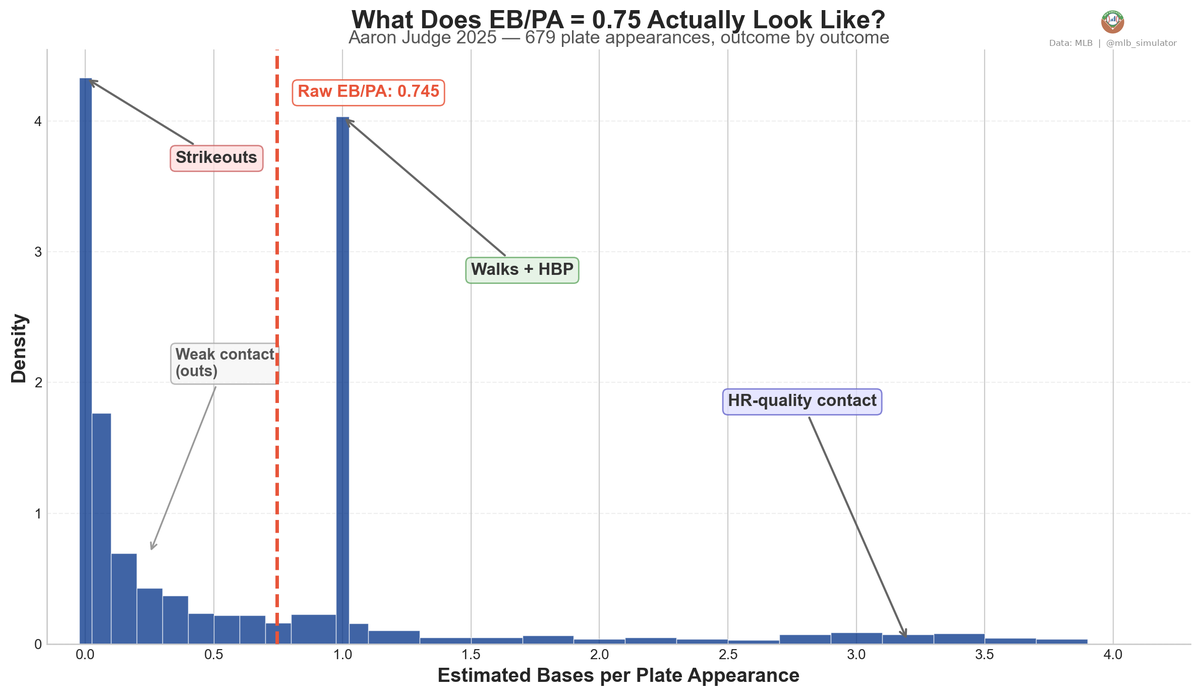
What does Est. Bases per Plate App (EB/PA) = 0.75 actually mean?
Example Aaron Judge (2025). Each plate appearance produces 0 to 4 estimated bases:
Strikeouts score 0
Walks/HBP score 1
Batted balls range from ~0-4 (using the in-game model)
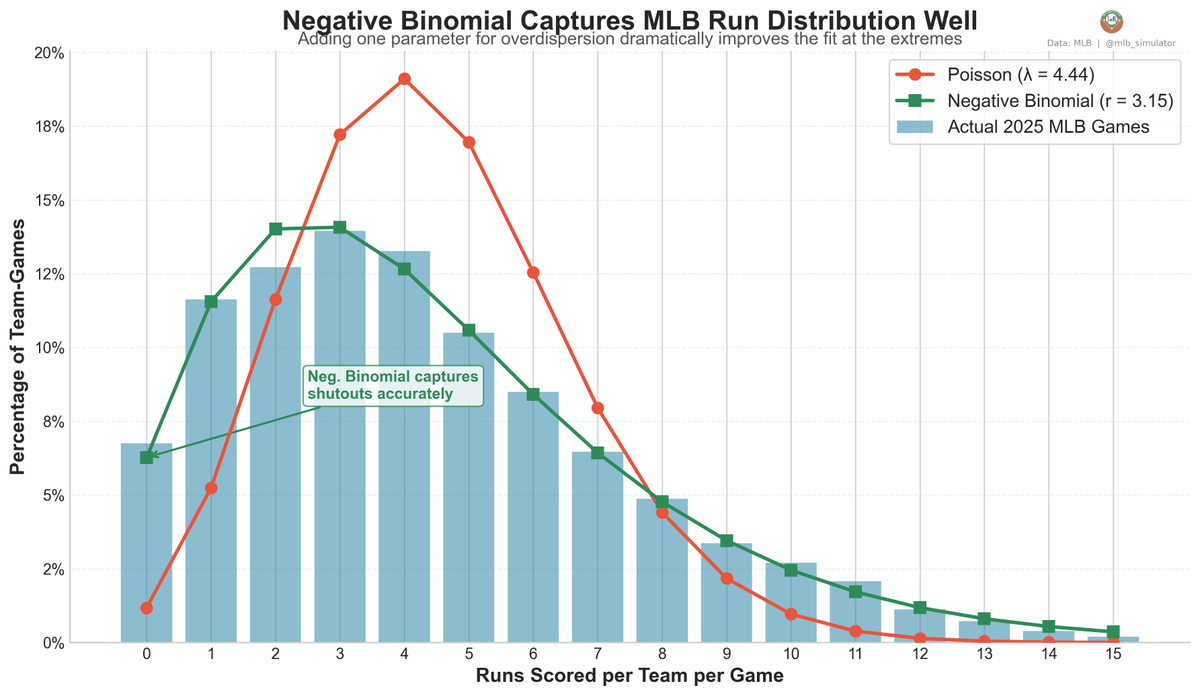
How random is baseball scoring?
I tested two probability distributions against every 2025 MLB game. The Poisson distribution gets the general shape right but badly underestimates shutouts and blowouts.
The Negative Binomial instead captures this variance well, including the extremes.
#MLB #Probability