DevOps & Cloud Architect from Bangalore
Helping engineers ship faster and spend smarter on GCP,AWS, Kubernetes & Terraform.
Real stories from production |
Most people think Docker is just "run a container."
Here's what's actually happening under the hood 🐳
Docker has 3 core parts:
1. Docker Client — What you interact with. Type docker run or docker build? That's the client.
2. Docker Daemon (dockerd) — The brain. Runs in the background, builds images, runs containers, manages networks & volumes.
3. Docker Registry — The storage. Docker Hub is the default. Run docker pull nginx? The daemon fetches it from here.
How they work together when you type: docker run nginx
→ Client sends the request to the Daemon
→ Daemon checks if the image exists locally
→ If not — pulls it from Docker Hub (Registry)
→ Daemon creates and starts the container
→ You see nginx running ✅
One command. Three components. Working silently together.
The part most tutorials skip:
Docker uses client-server architecture. Your client and daemon don't need to be on the same machine — run the daemon on a remote server, control it from your laptop.
That's exactly how Docker works in CI/CD pipelines. Your GitHub Actions runner is the client talking to a daemon running elsewhere.
Understanding this changes how you think about Docker in production.
What part of Docker architecture confused you most when you started? 👇
We had a incident last year that took 3 engineers 6 hours to solve.
Symptom: random 10–15 second API timeouts. Only some users. No pattern.We checked:
→ App — fine
→ DB — fine
→ Load balancer — fine
→ Kubernetes pods — fine
Root cause?A misconfigured iptables rule was silently dropping packets from specific IP ranges.
The stateful connection tracking was causing slow requests to be dropped without any log entry.
The fix — one command:
#iptables -nvL | grep DROP
Found a rogue DROP rule added during a "security audit" 3 weeks earlier.
Network latency is not a single metric. It's the sum of multiple delays in your request path.
When your API is slow, check in this order:
# Step 1 — DNS resolution time
dig +stats https://t.co/GoRJxkSmEO
# Step 2 — TCP connection time
curl -o /dev/null -s -w \
"DNS: %{time_namelookup}s\n \
TCP: %{time_connect}s\n \
TTFB: %{time_starttransfer}s\n \
Total: %{time_total}s\n" \
https://t.co/nnUrLjYEhB
# Step 3 — trace the network path
traceroute https://t.co/GoRJxkSmEO
# Step 4 — check for packet loss
mtr --report https://t.co/GoRJxkSmEO
Most teams skip Step 1 and 2.
DNS alone causes 30% of "random slow API" incidents.
High latency in Kubernetes services — where to actually look:
# Check if DNS resolution inside cluster is slow
kubectl run -it --rm debug \
--image=busybox --restart=Never \
-- nslookup your-service.namespace.svc.cluster.local
# Check CoreDNS logs for errors
kubectl logs -n kube-system \
-l k8s-app=kube-dns --tail=50
# Check if kube-proxy is healthy
kubectl get pods -n kube-system \
| grep kube-proxy
# Test service-to-service latency
kubectl exec -it <pod> -- \
curl -w "%{time_total}" \
http://target-service/health
90% of Kubernetes "slow API" issues are CoreDNS or kube-proxy.
Check these before blaming your application.
For a new production workload in 2026, you pick:
A) Kubernetes on EKS/GKE/AKS
B) Cloud Run / App Engine — serverless containers
C) Lambda / Cloud Functions — pure serverless
D) Plain EC2/VM — keep it simple
What's driving your choice? Cost, complexity, or control?
Biggest Kubernetes pain point for you in prod?
A) YAML complexity
B) Networking & Ingress issues
C) Resource limits & OOMKill
D) etcd backup & disaster recovery
Drop your war story below 👇
Anthropic said : "Claude is probably as good as a mid-level engineer at writing code."
That's not a boast. That's a signal.
Engineers who adapt to AI will do more. Engineers who ignore it will do less.
The gap is widening every single week.
Which side are you on?
Gemini app crossed 900 million monthly active users — more than double last year's 400 million.
That's 2.25x growth in 12 months.
ChatGPT took 2 years to hit 100M.
Gemini is running at a completely different pace.
@Saanvi_dhillon No, don’t do it. Keep tracking the latest posts, send emails directly to HR, and schedule interview calls. If you have any alternative suggestions, please let me know. I’m getting almost zero calls from Naukri.
@nadeem_jaleel@Polymarket Same 😂
One interest rate announcement and suddenly I’m analyzing inflation, bond yields, and GDP like I work at the central bank.
@isha_singh06 Yeah, I try to keep it around 5–10 matched applications daily instead of mass applying. Focusing more on relevant roles and tailoring my resume a bit for each one.
You do not need 50 dashboards to monitor a production system. You need 4.
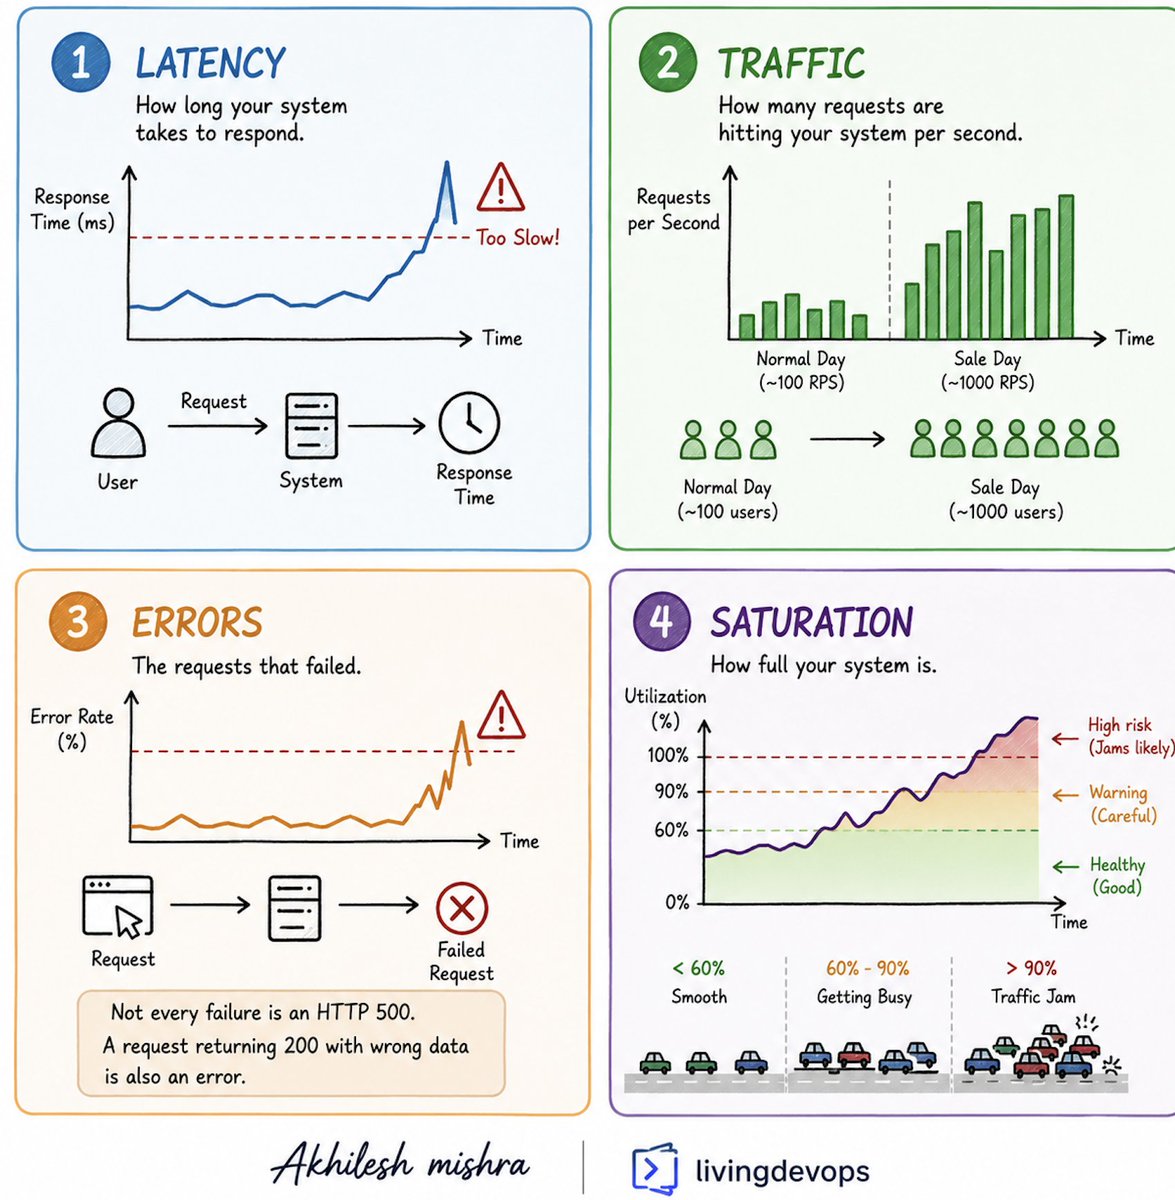
Google’s SRE team called them the Four Golden Signals. Most experienced engineers follow some version of this framework, even if they do not call it that.
And they are:
Latency, Traffic, Errors, Saturation
>> Latency is how long your system takes to respond.
- Think about ordering food at a restaurant.
- If your food takes 20 minutes to arrive, something is likely going wrong in the kitchen.
- Systems work the same way because users hate waiting, and slow systems often create a worse experience than systems that fail clearly.
>> Traffic is how many requests are hitting your system.
- Think of it like customers entering a shop.
- On a normal day maybe 100 people visit.
- During a sale that number becomes 1000.
- Every other metric only makes sense when you know how busy your system is.
>> Errors are requests that failed.
- Think about a vending machine taking your money and giving you the wrong snack.
- It did not crash.
- It did not show an error.
- But it still failed.
- Not every failure is an HTTP 500. A request returning 200 with bad data is also an error.
>> Saturation is how full your system is.
- Think about traffic on a highway.
- At 60 percent capacity, everything moves smoothly.
- At 90 percent capacity, even small issues create traffic jams.
- Saturation is often the warning sign. Latency and errors usually come after.
The order matters.
> Traffic creates load.
> Load increases saturation.
> Saturation raises latency.
> And latency eventually becomes errors.
If you are new to DevOps or SRE, stop trying to monitor everything.
Start with these four. Build dashboards around them.
Build alerts around them.
When production breaks at 2 am, these four signals usually tell you where to look first
👉Comment if you need a detailed blog post on it, with real examples.
If you're starting a new project today — which cloud?
A) AWS — ecosystem king
B) GCP — best networking + AI tools
C) Azure — enterprise & Microsoft stack
D) None — Vercel/Render is enough