We are 8 Billion people on earth.
Technically we have enough food, enough water.
Yet people are starving & kids are being bombed!
I wish for a world fueled by peace. This will
not be archived as long as there is evil.
Accept Jesus Christ as your Lord and Savior!
Polymarket is pricing in a 100% chance that the Fed ends QT before May.
If Powell even whispers “QE” at the next FOMC, markets will move fast.
But knowing Powell, he’ll keep it as vague as possible.
Big Pharma doesn't want you to know this...
Millions are suffering from anxiety, fatigue, and other health issues—yet the root cause is often overlooked: magnesium deficiency.
Here’s how magnesium affects your body and how to fix it (according to science):🧵👇
💵 "Not QE, QE" has officially started
A liquidity injection that could total up to $842bn from the US Treasury General Account began this week.
Functionally, this is similar to Quantitative Easing, but on a temporary basis.
Here's everything that is happening, in simple terms...
From my understanding, the official "debt ceiling-induced" Treasury General Account (TGA) drawdown began on Wednesday February 12.
As the US Government's $36 trillion debt limit is now binding, the Treasury cannot issue "new" debt.
So, it is being forced to use cash from the TGA to fund spending.
This is a liquidity injection, flooding the market with "new" liquidity and pushing up bank reserves.
This train is now in motion and will not stop until lawmakers come to a new debt ceiling agreement (probably involving raising or suspending the ceiling).
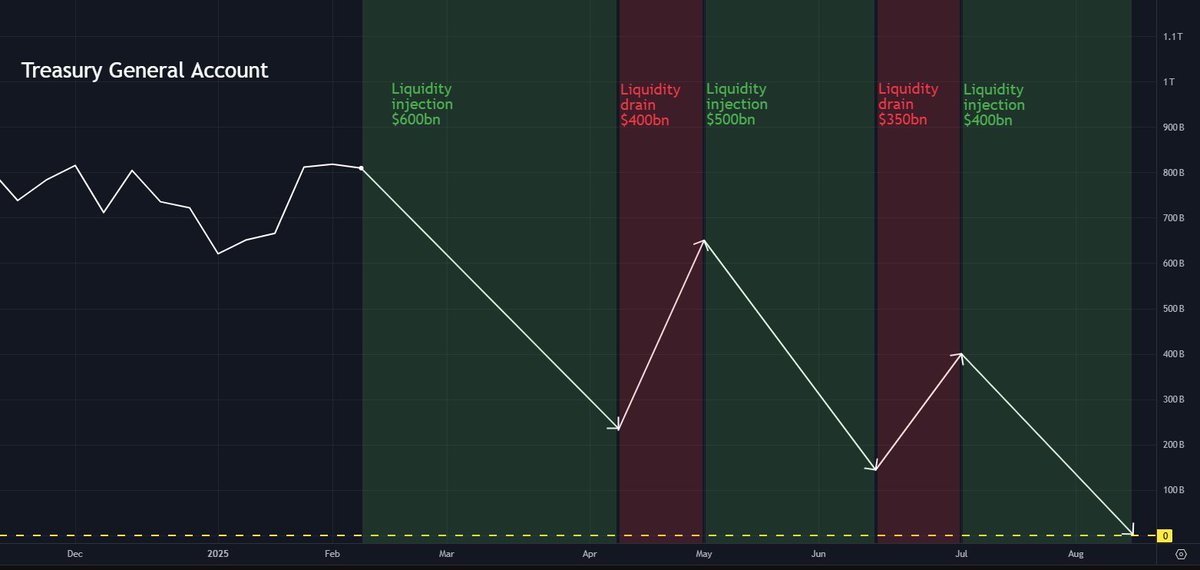
On Tuesday February 11, the TGA balance stood at $842bn.
So, the potential maximum length of the train tracks is $842bn.
My rough estimated path for the train is this:
I estimate the first "portion" of this drawdown will see a liquidity injection in the region of $600bn between February 12 and April 11, before taxes will temporarily fill up the TGA.
However, the most important metric to follow to determine any potential impact on markets is the "net" liquidity injection from all Federal Reserve sources.
This will very likely will be lower than $600bn.
For two reasons:
1⃣ QT continues
The Federal Reserve is continuing with its Quantitative Tightening regime.
This continues at a pace of roughly $55bn per month.
This is a liquidity drain, as the Fed allows assets on its balance sheet to mature without reinvesting the proceeds, effectively shifting them back to the market to absorb.
I think it is unlikely the Fed will stop QT at the next FOMC meeting on March 19.
So, the total liquidity drain from QT will probably be roughly $110bn over the duration of this first portion of the TGA drawdown.
2⃣ Reverse Repo usage may increase
Due to the debt-ceiling dynamics and the rules the Treasury must follow, we are likely to see "net negative T-bill issuance".
This means the Treasury will issue fewer T-bills than previously planned, reducing the overall supply available to the market.
The Treasury has already begun to trim supply of bills auctions.
If the debt-ceiling deadlock persists, T-bill issuance will likely continue to decline, making bills increasingly scarce.
This may incentivize money market funds to park cash in the Fed's Reverse Repo, potentially pushing this chart up, or least stalling its downward momentum.
Reverse Repo usage increasing would be a liquidity drain, as money would be moving away from markets and into the Reverse Repo facility at the Fed.
So, watching the Reverse Repo will also be key to determining the "net" liquidity injection from Federal Reserve sources.
The total "net" liquidity injection will be reflected in the chart below.
This chart increased by around $50bn this past week.
I'll continue to post updates here on X.
🤔 When will a new debt ceiling agreement be reached?
It doesn't look like a resolution to the debt ceiling showdown will be coming anytime soon.
On Wednesday, House Republicans offered up a plan to enact trillions of dollars in tax cuts and raise the debt ceiling.
Passing this measure will be tough however, given the Republicans' fractious and narrow majority.
Democrats are expected to be unified in opposition.
This comes down on the shoulders of House Speaker Mike Johnson, as he attempts to rally lawmakers behind the plan.
The problem is that a relatively large group of very conservative Republicans are opposed to raising the debt ceiling on principle and have never voted to support an increase.
Their leaders have made the point that even a call from the President won’t sway some of these members.
Previous debt ceiling increases have required bipartisan support.
Jak dominacja #BTC#Bitcoin tym razem nie spadnie, to proszę nie do mnie :). Ja tylko mówię, co widzę ;).
Widzę, że jak nie klepną budżetu, to saldo TGA w pierwszej nodze spadnie w okolice 200-250 mld do pierwszego tyg kwietnia.
W dwóch ostatnich przypadkach spadku TGA spadała też dominacja.
Po prostu liczę, że historia się powtórzy i zrobi #Altseason2025 ;)
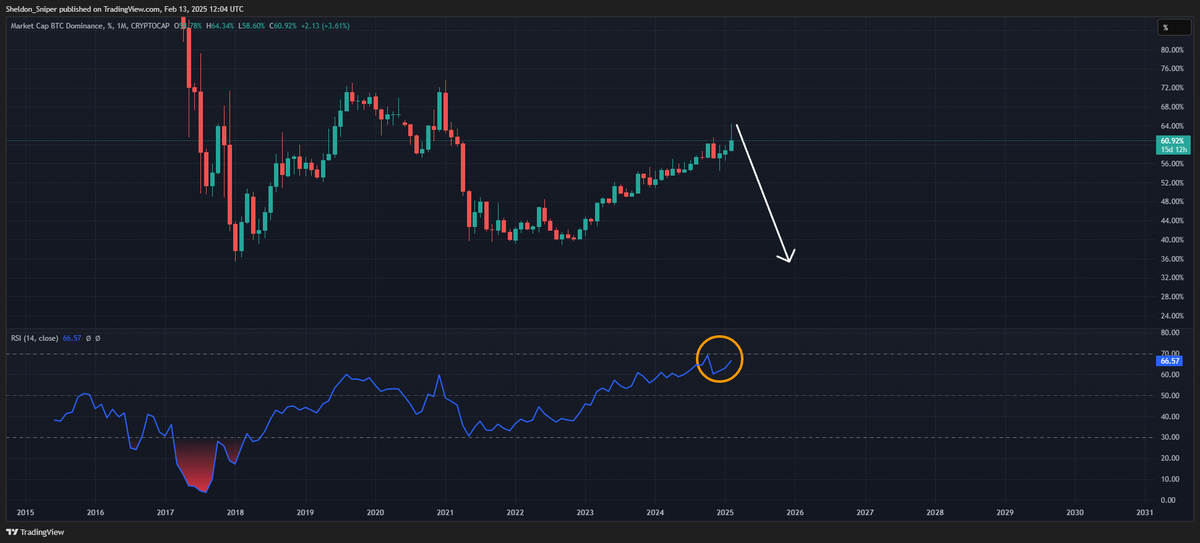
This is the highest the RSI has ever been on BTC dominance and people still trying to convince me there is no alt season coming .
The dominance collapse is coming ...
$BTC .D Monthly chart
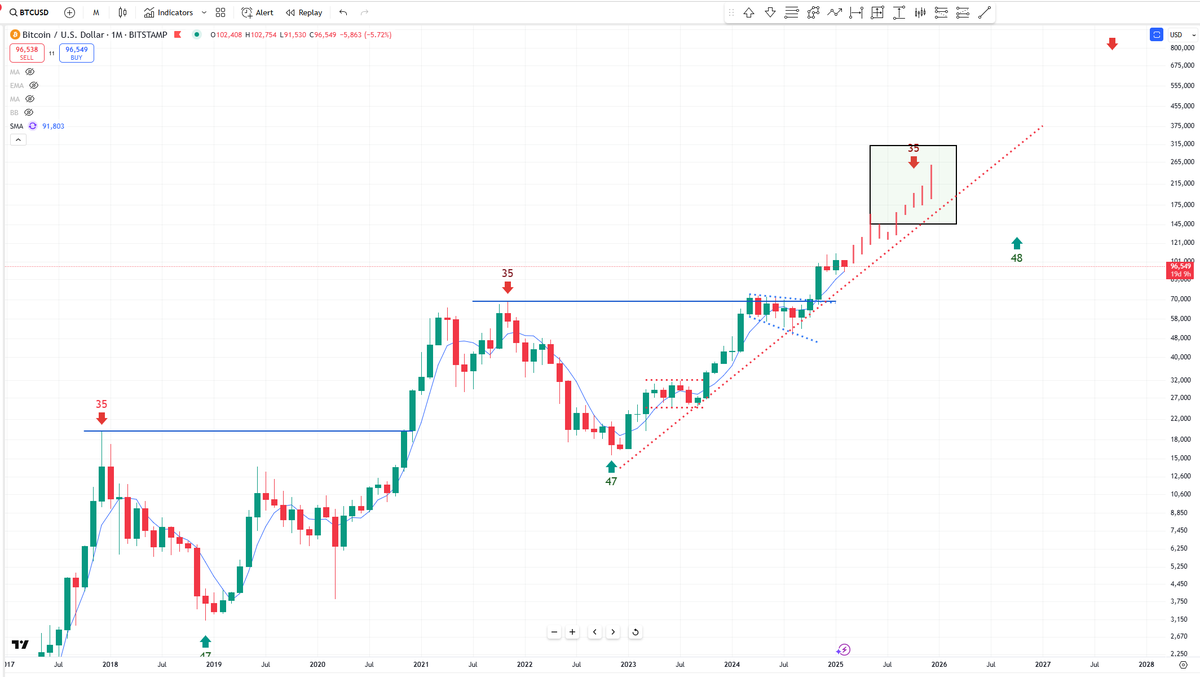
The Bull case of a normal #bitcoin 4-Year Cycle. If it follows prior Cycles AND how it's trended in this cycle.
Caveat - this is simply trend following and outlines a repeat cycle performance. Will cover this in an upcoming new 4yr cycle video.
New Weekly Cycle starts end of this month, peaks in May/June. Final weekly cycle (to the top) starts Aug to final peak Oct-Dec for a 35-36 month high.
The four main Weekly Cycles this 4yr cycle have consistently moved 90-100% from low to high, with 20% pullbacks, except Mar/Sep '24 -30% decline, which was the MIDpoint event of the 4 yr cycle.
The chart below shows
a) repeat structure of prior 4 year cycles (i.e top around 35 months)
b) two more weekly cycles of around 90% gain cycle low to high.
c) Comfortably respects the trend-line of this cycle within the time-period.
Is this a guarantee? hell no. The last cycle fell short of a final extension, as an example. But it has good probability as it's rooted in following a trend and pattern over the current 4yr cycle and the prior 14 yr period.
Breaking: US Fed puts out their 2025 monetary policy report - juicy - they announced they are ending Quantitative Tightening in June After a $2 trillion reduction, lowering the balance sheet to below $6.4 trillion and selling securities holdings down $300 billion since June 2024.
https://t.co/fZiDNMdtkQ
IMO: this news will hit the markets Monday and front running will begin.
Day 38 of the Bitcoin cycle. Still think end of Feb, around Feb 20-25 Bitcoin can bottom and resume the bull trend.
Question is can it hold the range until then.
Next visit > $106k is likely new cycle and won’t look back.
🚀 #Altcoin Opportunity? 👀
#ALTS are back at the lower trendline! Last cycle, an #RSI retest marked the final shakeout before liftoff. 🚀
Will history repeat? 🤔🔥
⚡ Don’t miss the next big move! Free signup here: 👉 https://t.co/VVvap9kJjN
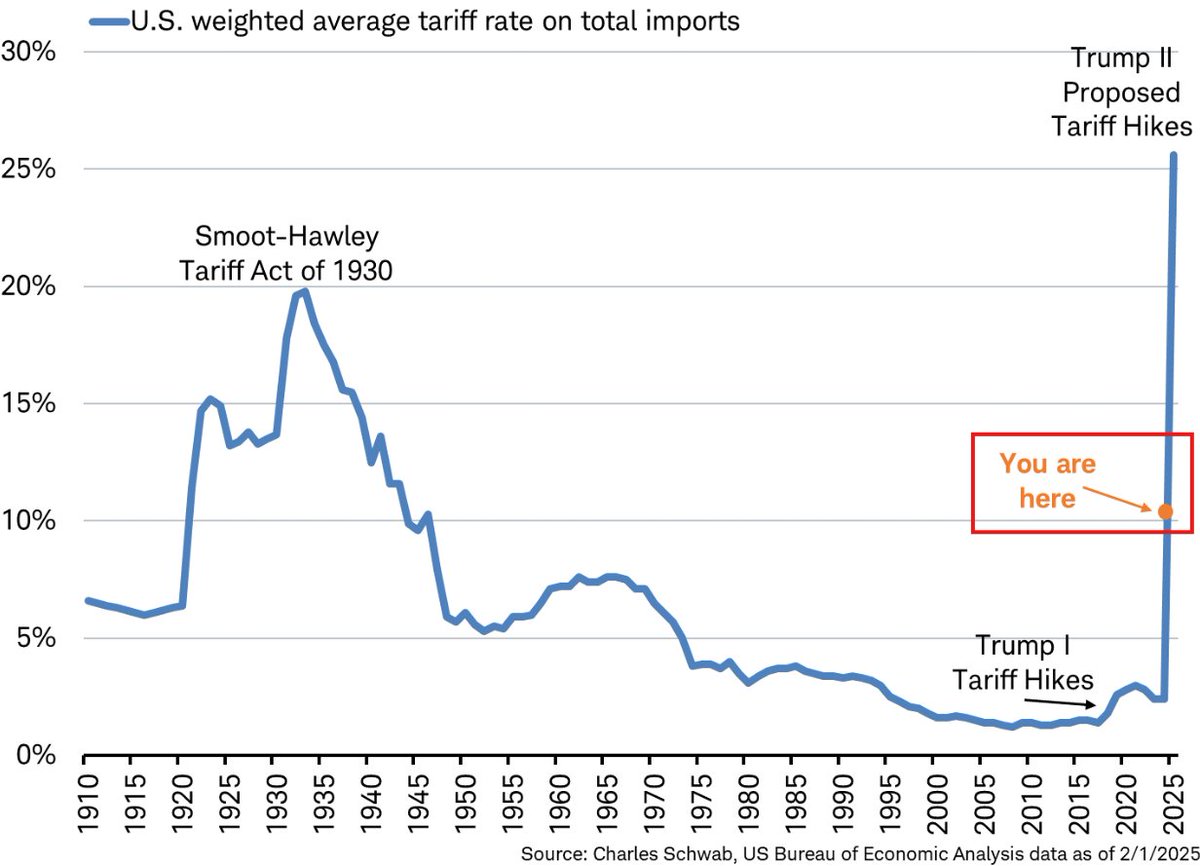
The trade war is LIVE:
New tariffs from President Trump are set to impact $1.3 TRILLION worth of US trade.
The US stock market has lost over -$1.5 TRILLION of market cap with ~43% of all US imports soon subject to tariffs.
What does this mean? Let us explain.
(a thread)
Trolling aside,
This is peak 2022-esque capitulation.
Almost feels identical to the FTX implosion [for alts - not BTC].
Mini bear market in the greater bull market.
I don't think we've topped "macro" wise,
We end up higher mid/long-term on strong coins.
Problem is, most of you will end up grinding your cash stack to zero buying every "potential bottom" that just goes lower.
Don't get wiped out revenge trading.
God bless.
Retar Dio.
Liquidation Levels - 3:15pm Feb 2nd
$BTC $ETH $SOL are bounced on max pain almost to the dollar.
$96868 $2897 $195 on #Binance - max pain was $96800 $2930 $200
New leverage long liquidations (new blue lines) on Bitcoin extend to 94800 now. #Binance may capitulate them but typically max pain is their goal. Remember the market is in their hands. They control the Futures markets.
https://t.co/ggEYmk6hAf
I was the lead market maker at Jump.
I'm no longer under NDA so I can say this,
Typically when you see down moves during the weekends like this, it is pure market manipulation.
It was one of the tactics I invented during the low volume moments.
We would load up and pay attention to Crypto Twitter as a source of sentiment, with specific accounts organized in specific categories.
One thing I used to like doing was purposely "nuking" a new 4H candle on BTC and/or ETH, which was an easy trap.
"Smart" traders know we'll eventually revisit those wickless candles, so it was good bait for me to set with eager buyers stepping in and the candle continuing lower.
They end up capitulating before we reverse.
Bottom shorters get comfortable here too.
Anyway, I can't give away too much but just know,
Most of thos "bad" price action you're seeing is a group of "whales" sitting in a chatroom together and merely oil painting on charts.
My alias in Jump was "Vincent van Gogh."
And that isn't because I lost my mind [well - that too],
But because I painted some of the best looking bear traps.
I know an influenced painter copying my work when I see one.
Stay safe.
Retar Dio.