Wining an award is always special.🏆
Recently, I was blessed to be awarded as a Promising Alumni from my undergraduate college MIT Academy of Engineering. 🎉 Thank you for this token of appreciation. 🎗✨ #awards#thankyou
Hello Ladies! We are excited to present our very first in-person event for the year: Building a new geom in ggplot2 by @SayaniGupta07. Dr. Sayani Gupta will teach you how to build new plotting symbols that are not implemented in #ggplot2 yet. Join us from: https://t.co/VkJDOkc3Cw
Wining an award is always special.🏆
Recently, I was blessed to be awarded as a Promising Alumni from my undergraduate college MIT Academy of Engineering. 🎉 Thank you for this token of appreciation. 🎗✨ #awards#thankyou
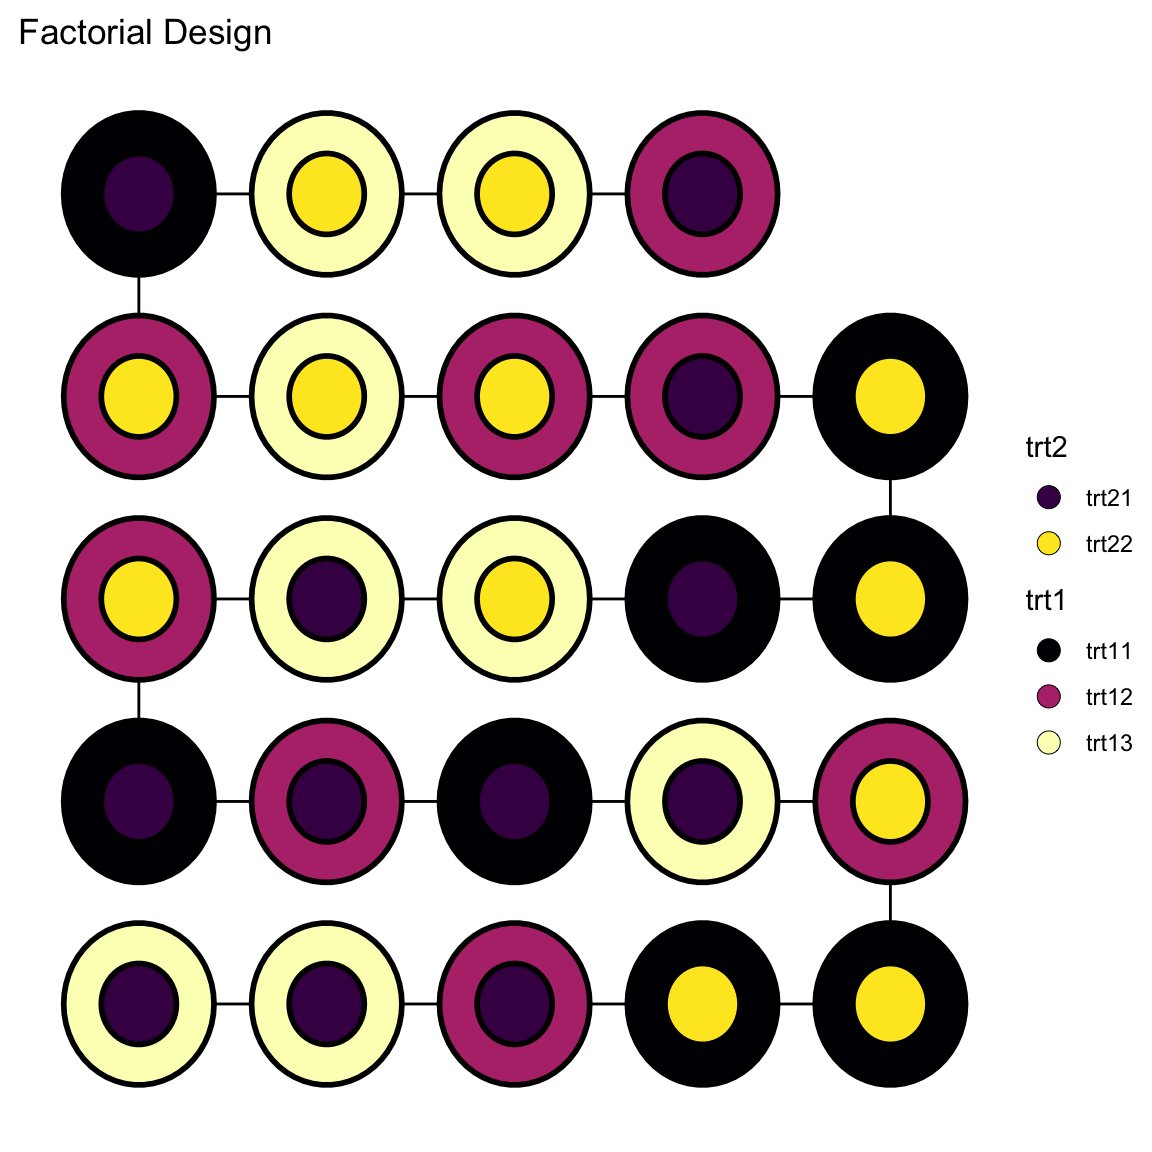
{edibble} now can make a range of named experimental designs. I've been working more on {deggust} which automatically visualises edibble designs (with just one command!), but trying to think what is a sensible default structure. Thoughts welcomed!
📖 https://t.co/1LBA75kBJI
If you want to learn more about RStudio Cloud, Patricia Menendez (@PM_maths) is talking about her experience using it in teaching as part of @rstudio community events!
📅 https://t.co/vSWRpv7Odu
Check out also other talks:
🔗 https://t.co/6tXO0SiJXE !
Change in academia is often slow. But now, the @MonashBusiness School will allow #Software to be used as 1st class research output for the purposes of promotion. Will others follow?
Our podcast features: @robjhyndman @TomHoneyman3 & @nj_tierney
https://t.co/eVEJv9LyEo #RStats
She's considered a world leader in #DataVisualisation. We're honoured to have @MonashEBS Professor Di Cook @visnut as our guest this week on our podcast, The Random Sample, with host @Sevvandik. https://t.co/cHKSNrwjhx
#RStats
Yaaay! Presenting my first ever R package on CRAN called learningtower. Thank you Prof Di @visnut and Kevin @KevinWangStats for this opportunity and your incredible guidance. #rstats
Introducing the {learningtower} package!
It provides a user-friendly interface to a subset of variables from the PISA data, for the years 2000 - 2018, incl. student's maths, reading and science scores in standard testings and socio-eco status. #rstats
https://t.co/cifWsT5CXU
Hey Everyone,
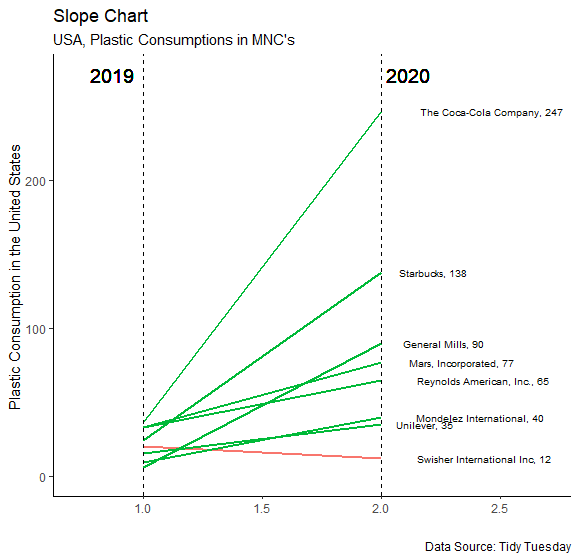
Here's presenting my first ever slope chart using R, that tells us about the plastic consumption of some of the popular multinational organizations in the United States in the years 2019 and 2020. Data Courtesy - @sarah_sauve -Thank you for this #TidyTuesday data.