TSLA Enthusiast. Human Futurist. Trading equities since 2009. Everything I say and write is merely my opinion and is not to be construed as Financial Advice.
I used to take chart requests 3 years ago.
Then it got too much, and you couldn't pay me enough to do it.
Now you can all make https://t.co/JGR6S4xZVa your b*tch, fulfill all your charting needs, and make all of your charting fantasy come true. 🐈💕
New and improved this week !
@GreatMattsby’s weekly update is live 🎥
$TSLA $PLTR $COIN $MSTR $IREN $CIFR, all run through his Gann Bot's automated Gann Square and Square of 9.
Where each one sits, the levels that matter and the weekly closes to watch 👇
Stop relying on someone else's hand-drawn Gann chart.
Two traders draw the same Gann Square and get two different answers. That's the problem with drawing by hand.
Gann Bot fixes it
It's 100% automated. Load any stock, crypto, commodity or ratio and the Gann Square and Square of 9 draw themselves.
Anchored by the math, not by someone's eye: same chart, same lines, every time. No subjective analysis.
Then ask Gann Bot what the levels mean and it reads them back to you in plain English.
50% off for the first 100 members 👇
https://t.co/NOjR2GrMtp
Still waiting on someone to answer your chart request?
Meet Gann Bot ( https://t.co/CvSA4NEXpU ) 🚀
Load any crypto/US stock/ETF and the Gann Square, Square of 9, Ichimoku and more are fully automated. No more drawing by hand. Ever.
Your tutor, guide and assistant, all in one. 🧵
Historically, $NVDA's monthly Bollinger Bands have rarely been AND stayed that tight for long.
Implies increased volatility is coming soon, as signaled by a potential increase in Bollinger band width.
Another one of my terrible charts. 🤣 $GDXU where'd we close fam? $74.24 lmfao $0.72 off my target I gave you almost 3 weeks ago. $GDX $GDXU too bad I didn't keep my short. 😭
⚠️ **WARNING: AI bubble pop-risk crossed 7 today.** It's 7.0/10, up from 6.0 yesterday and the first time over the alert line. Credit stress is spreading and breadth broke, but GPU rents still haven't turned.
**1. Credit stress has reached a hyperscaler.** Meta's 5-year credit default swaps (the cost of insuring its debt) hit a record of about 115bp ([Reuters](https://t.co/nRD1QHY18V)). Meta also plans a new non-voting share class that could raise hundreds of billions over several years to fund AI. It burned cash for the first time in over a decade.
CoreWeave's 2031 bond yield hit a record 15.76% and its CDS is around 1,115bp. The stock is near $56.50, roughly 70% below its peak ([Benzinga](https://t.co/jbxMncbVwt)). Jensen Huang told CNBC that neocloud demand is "off the charts" but capital is scarce ([CNBC](https://t.co/UOny2JX4mu)).
**2. The market sold good news.** Meta beat estimates and raised its 2026 capex to $135–145B, yet fell about 7% to $648.85. The chip index (SOX) dropped 6.72% to its lowest close since July 29, with all 30 members down. Elsewhere:
- Nasdaq: -2.6%, its worst day since June.
- NVDA: -4.4% to $212.21.
- AMD: down more than 8%.
([CNBC](https://t.co/jdOmF4Sefz), [AP](https://t.co/RClAaUjLKH))
**3. Why it's 7 and not higher:** GPU rents are still firm. Silicon Data has H100 at $2.88/hr, up 10% over a week, and B200 at $6.29 ([Silicon Data](https://t.co/KbEu88KiFt)). Nobody has cut capex; Amazon is planning about $220B. This is a funding squeeze on top of strong demand, not a demand crack yet. It also keeps fitting the "credit first, rents later" idea, so rents are the next thing to break if this is a top.
None of the six watch tests resolved today. Research only: nothing was traded, posted or emailed.
$SPCX
At this stage, the support band is decisive. It’s shaking us out with gaps. If the support band breaks, the bullish order block zone below could soften the selling. But as I said, the support band is decisive
AI bubble weekly: pop risk is 7.0/10, up from 6.0 last Friday and unchanged since Thursday's warning.
The main driver is credit stress spreading from neoclouds to Meta, whose 5-year CDS hit a record 114.79bp, while GPU rents are still rising rather than softening (Plutux on AI credit).
The next big test is capex guidance from Microsoft, Alphabet and Amazon, who report next week.
Semis $SMH are not looking the best right now, indeed.
I see that some seem to want Semis to top this cycle.
But I dare you: if Semis completely top out now, the whole cycle would end.
Is that what's likely to happen alongside the AI boom and economic expansion?
I don't think so.
Thus, I think Semis are having a correction, but are likely to, at some point, reach new highs again, and I will keep holding my $AMD position.
$SPCX is under sustained intraday selling pressure, declining from the $155.15 area to $147.03 while remaining below the descending VWAP near $151.03. Repeated red sell bubbles reflect persistent supply, with $145.15 as the next major liquidity test. Reclaiming $150.15 would improve the short-term structure, but sellers retain control beneath VWAP.
COB: Major overhead liquidity is visible at $165.15. Below price, substantial resting liquidity sits at $145.15, followed by $140.15, $135.15 and $130.15. The $145.15 level is the nearest significant downside liquidity magnet.
SVP: The strongest visible volume concentration sits near $150.15, with additional participation around $147.15 and $140.15. Trading beneath the dominant $150.15 node reinforces bearish positioning unless buyers reclaim that area.
Order-flow outlook: Sellers retain control while price remains below VWAP. A break beneath $145.15 exposes $140.15, while reclaiming $150.15 would signal improving buyer participation and open a recovery toward $151.03 VWAP.
$IREN
It has sold off very sharply and is deeply oversold. A bounce is certainly possible, but it is not guaranteed. It is currently holding the support band, which is also the bottom of the pattern
Low key shoutout to @Micro2Macr0 who discovered me 3 years ago and gave me my first break on here.
Since then, I am still trying to figure out what it all means to have followers. 😅
Will forever be appreciative. 🫡
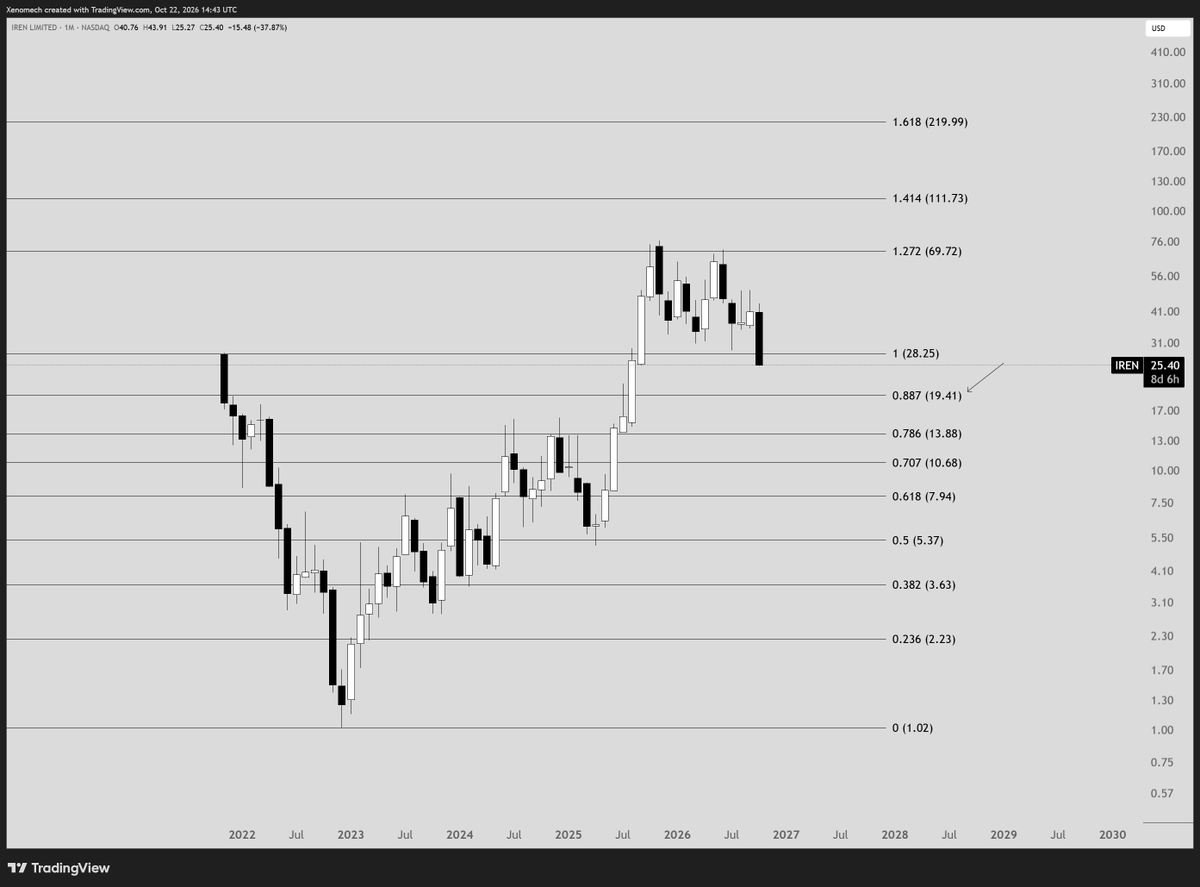
@cantonmeow made a great video recently about the importance of the 0.886 fib, especially when a stock pushes past the 1 multiple and doesn't extend all the way to the 1.618.
He may be right (once again), as $IREN is showing early signs of wanting to revisit that same fib at around $19.40.
It would be one more to add to the list.