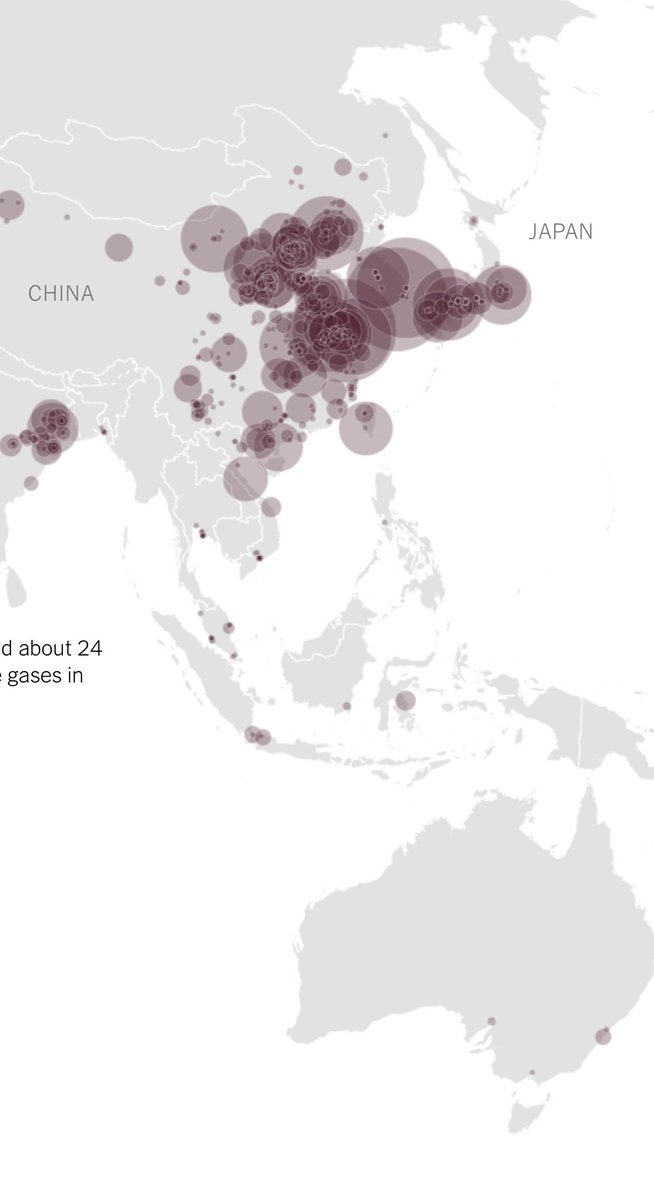
Today we released @ClimateTRACE, the most detailed facility-level global inventory of greenhouse gas emissions ever-- mapping emissions data for +70,000 individual sources worldwide #cop27 https://t.co/IBQqgvwzix
Thank you @Geovation for recognizing our work on @minderoo Global Plastics Watch https://t.co/EhC0bVwf6H! Happy to share winning spot with @UP42_ , applying geographic innovation to preserve and protect the environment around us.
Chat with @openstreetmap! We’re exploring AI language models to make geospatial problems easier. This demo .. #ChatGeoPT .. hints at the potential and the challenges for building out geospatial AI
https://t.co/czEtZenkAW
How can #satellitedata help us pinpoint top GHG emissions sources and curb #climatepollution? For those who are new to the Climate TRACE approach, @GreenBiz and @wef answer that question and more.
🔴 Thinking about hopping on a livecoding stream on YouTube in a bit, gonna explore and prototype some ideas around climate change data, come hang out and riff with me around 1030EST 🌎 📈 https://t.co/re20ptkRD0
Wednesday is #30DayMapChallenge MOVEMENT day Check out the @ClimateTRACE location + emissions of 48000 ships https://t.co/kuoeoTYEly notebook courtesy of @ejfox
Share what you build!
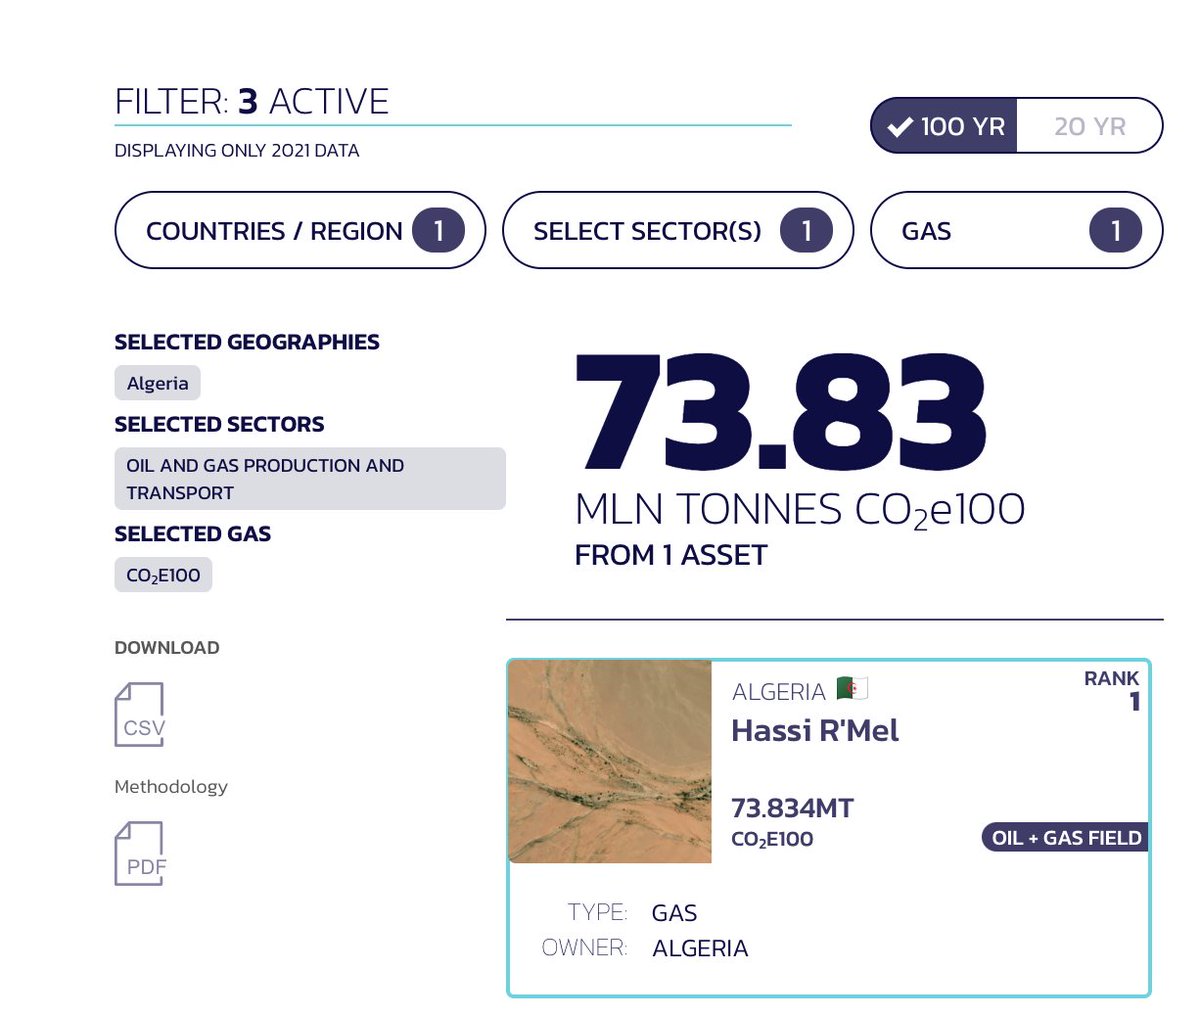
“The atmosphere doesn’t recognize borders, and the @ClimateTRACE satellites show outsize damage being done by, for example, an oil and gas field in Algeria producing more than 73 million tons of emissions.”@dwallacewells@nyt https://t.co/Nk5VVVImr3
@eric_van_rees I think the most interesting ones are the ones we don’t necessarily think as such?
@felt for pushing waaay outside of the geo bubble
@earthrisemedia focused on building products with a big design & storytelling component built in
After last week's Climate TRACE announcement, you may be wondering what's so important about facility-level #emissions data. This new blog breaks down several notable use cases for the new data, how these emissions are measured, and more. #climatedata https://t.co/kB1Q1waqY3
The @ClimateTRACE inventory of facility-level emissions data is free and publicly available https://t.co/w0zjoOl8WQ. Each download includes country emissions by sector + #GHG (2015–2021), facility-level emissions, and facility-level ownership data where available. #cop27egypt
Absolute transparency into the worlds largest polluters through the brilliance of @ClimateTRACE. You can’t have trust without transparency, and to see the absolute emission by every major emissions sources is absolute genius. https://t.co/TW5ch356I4
"How much are specific industries and companies emitting? In which countries?" @climatetrace tells us "tells us where the decisions need to be made, what actions need to be taken" https://t.co/d2sSqSXe4N @ClimateTRACE#cop27
Tomorrow, the @ClimateTRACE coalition will release a detailed inventory of GHG emissions from the largest individual sources in the world. For a sneak peek of how we're using AI to revolutionize emissions data, check out my op ed in @ScienceMagazine. https://t.co/DePVd5xSov
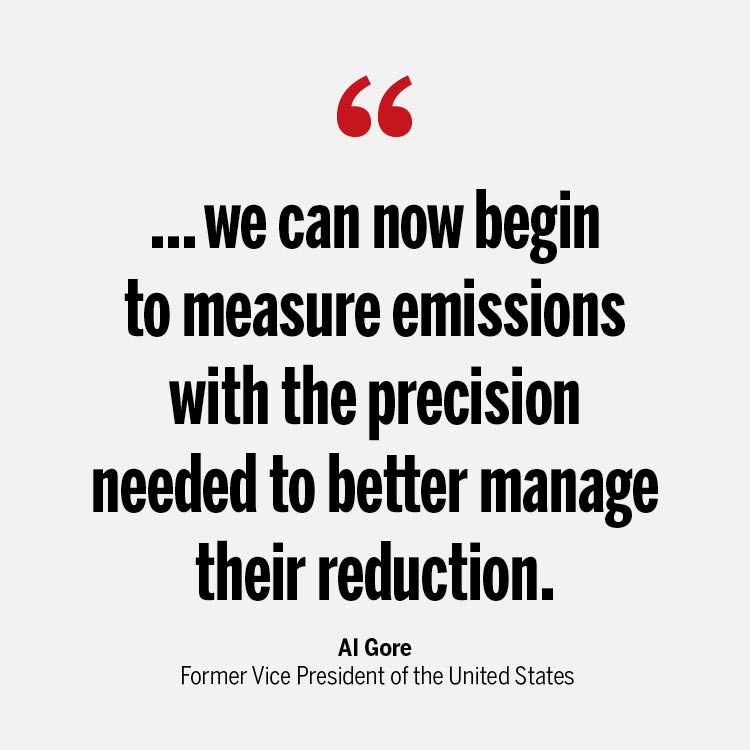
Collaborator @algore announcing the release of @ClimateTRACE, the first facility-level inventory of the largest known individual sources of #GHG emissions #COP27
https://t.co/CaQD8fc2hV
Next week, @ClimateTRACE will release the first facility-level inventory of the largest known individual sources of the 162 million tons of greenhouse gas pollution emitted into the troposphere every day.
Learn more in a #ScienceEditorial by @algore: https://t.co/z7CjS7g7AP