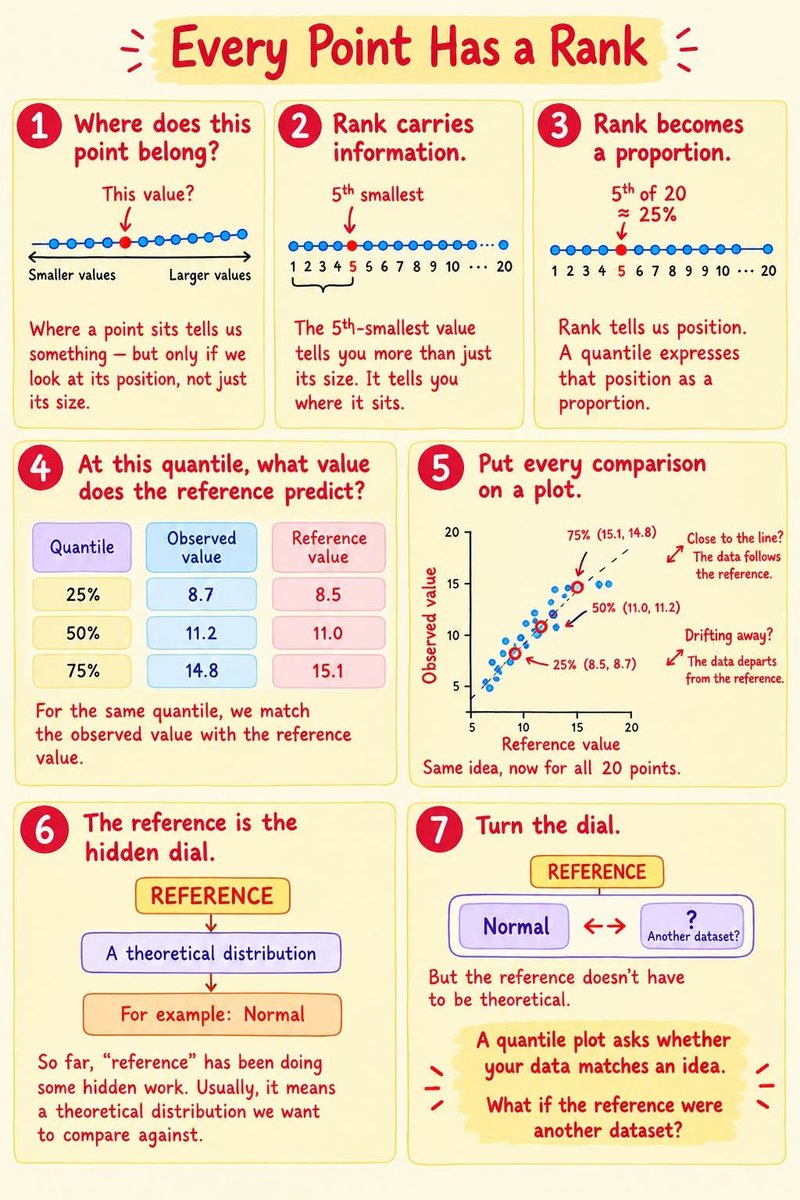
Every data point has a rank. Turn that rank into a quantile, compare it with a reference distribution, and you get a powerful diagnostic tool: the Q–Q plot 📈
If points follow the line, your data matches the reference.
#Statistics#DataScience#QQPlot#Quantiles#ResearchMethods
🚫 STOP telling Claude
"Write like a Human"
“Humanise this"
“Humanise that"
Bad prompting = Bad writing
Use this insane workflow instead & see the Magic👇
(📌 Save this before you write your next AI-assisted post)
📊 Correlation Matrices: Your Data’s Relationship Map!
A correlation matrix reveals how variables move together, with values ranging from -1 to +1. Positive values indicate variables move in the same direction, while negative values show inverse relationships.
🚨 Stop spending hours creating classroom materials from scratch.
Claude can build worksheets, quizzes, reading tasks, discussion questions, graphic organizers, and revision resources in minutes.
Here are Claude prompts every teacher should save 👇
(Save this for your next lesson-planning session)
Sample size is not one-size-fits-all.
The right formula depends on your population, study design, and analysis plan. A good sample size improves the validity, precision, and impact of your research.
✅ Don't choose the formula first—understand the study first. #SampleSize
🎯 Choosing the correct probability distribution is crucial for statistical modeling.
• Bernoulli → binary outcomes
• Binomial → number of successes in n trials
• Poisson → event counts
• Exponential → time between events
• Normal → natural variability around a mean.
Before claiming that one treatment, method, or strategy outperforms another, researchers often use ANOVA. By comparing variation across multiple groups, ANOVA provides a rigorous framework for testing scientific hypotheses.
📈 Data → Evidence → Knowledge
#Statistics#Science
DELETE UDEMY.
DELETE COURSERA.
DELETE SKILLSHARE.
Use Claude to build your own personalized online courses, quizzes, projects, and study plan.
Here are 08 Claude Prompts that can replace paid courses 👇👇
(📌 One save can replace your next paid course)
Why do some studies produce misleading results? 🤔
The answer may lie in extraneous variables: hidden factors like sleep, stress, noise, or temperature that influence outcomes without being the focus of the study.
Good research doesn't just measure effects. It controls the noise.
📊 Comparing two groups? The difference between two sample means has its own sampling distribution.
✅ Center = μ₁ − μ₂
✅ Variance = σ₁²/n₁ + σ₂²/n₂
✅ Approximately Normal (for independent samples)
A simple rule to remember: subtract the averages, add the uncertainty.
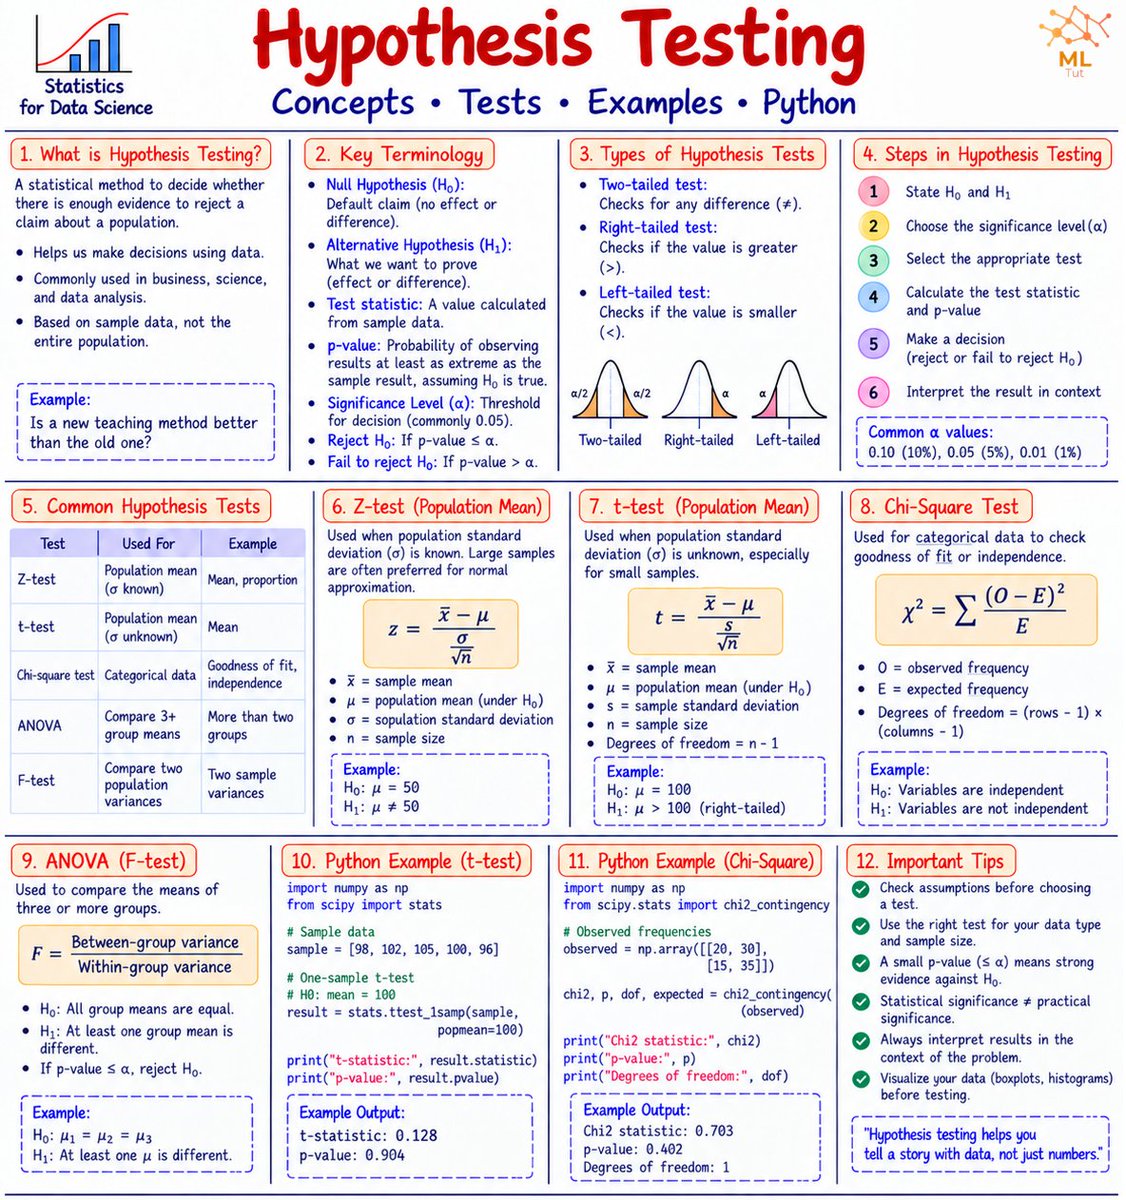
Ever spent more time choosing a statistical test than analyzing your data? 😅 Here's a practical roadmap to help you navigate t-tests, ANOVA, correlations, regressions, and more. Save it for your next research project! 📈🔬 #AcademicTwitter#Stats#ResearchMethods
🎓 Three teaching methods. 📈 Three different average scores.
But are the differences real or just random variation?
ANOVA provides the answer by testing whether at least one group mean differs significantly from the others.
Statistics turns data into evidence. 🔍
#ANOVA#Science
📚 Before running any statistical analysis, classify your data correctly.
A solid understanding of data types is the foundation of rigorous research and reliable conclusions. #Statistics#Research#DataAnalysis#AcademicTwitter
Your research deserves a title that gets noticed. ✨
From literature exploration to journal fit, AI tools can help researchers craft clear, novel, and impactful article titles.
Which tool do you use most? 👇
#ResearchTips#ArtificialIntelligence#Academia#HigherEd
The Fibonacci sequence can be used to quickly estimate miles in kilometers.
The sequence is formed by adding the previous two numbers:
1, 1, 2, 3, 5, 8, 13, 21, 34, …
For example:
5 miles ≈ 8 kilometers
8 miles ≈ 13 kilometers
13 miles ≈ 21 kilometers
21 miles ≈ 34 kilometers
This works because consecutive Fibonacci numbers have a ratio close to the golden ratio, about 1.618. The conversion factor between miles and kilometers is about 1.609, which is very close. Therefore, Fibonacci numbers give a convenient approximation for converting between miles and kilometers.