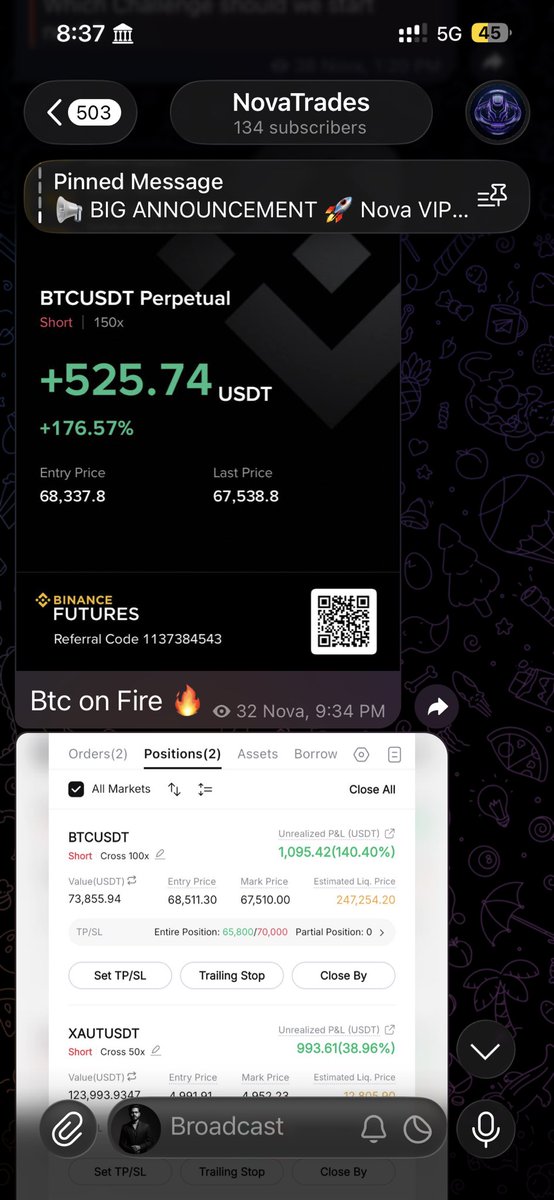
@mjtrader_@ckcapitaluk_ hello is these real
they dont payout
hell i m in account too
in evaluation phase
these is first of ur non payment issue or its happens many times
$BTC — Liquidity + Volume Bubble Read
This is an interesting BTC setup because the liquidation heatmap, volume bubbles and spot delta are telling us a very different story than simply looking at the candles.
BTC is currently trading around $63.5K, sitting between a major liquidity pocket below and heavy traded volume above.
The first level I’m watching is $63.2K–$63.3K.
We can see a meaningful concentration of liquidity around this area, with a large ~$23M volume bubble printed near the lows. This is important because price pushed into this region, generated significant volume, and managed to hold rather than immediately continuing lower.
That suggests there is at least some absorption/demand appearing around the $63.2K area.
But the bigger question is whether buyers can actually reclaim the levels above.
The overhead supply is significant.
Around $63.7K–$64K, we have multiple large volume bubbles:
~$28M around the current upper range
~$23M of positive volume around $64K
Another significant ~$28M print around $64K+
And further above, the $64.4K area has another large concentration of traded volume.
This tells me that BTC has already done a lot of business in this region.
So if price wants to move higher, I don't want to see a weak grind into these levels.
I want to see acceptance + aggressive buying + liquidation of shorts.
The interesting part is the Spot Delta.
Aggregated spot delta is currently around -$276.9M, while the latest reading is approximately -$729K.
That means spot sellers have been quite aggressive during this move.
Yet despite that selling pressure, BTC is still holding the $63.2K–$63.5K region.
That divergence is something I’m watching closely.
If sellers are aggressively hitting the market but price is no longer making meaningful downside progress, we can potentially be looking at absorption.
And if that absorption is real, the next move could be a squeeze higher once the supply above gets taken.
My key levels:
$63.2K–$63.3K → Major liquidity / demand area
$63.6K–$63.8K → Immediate resistance
$64K → Major volume/liquidity cluster
$64.4K → Larger overhead resistance
The bullish scenario is straightforward:
Hold $63.2K → reclaim $63.7K → accept above $64K → squeeze toward $64.4K+.
The bearish scenario is equally important:
If BTC loses $63.2K with strong spot selling and fails to reclaim it, then the current absorption thesis becomes much weaker and we could see the liquidity below getting hunted.
So I’m not interested in predicting the next candle here.
I’m watching how price reacts to the liquidity.
If BTC keeps absorbing aggressive sellers around $63.2K and starts reclaiming $63.7K–$64K, that would be the first confirmation that buyers are actually taking control.
$63.2K is the level I’m watching most closely.
💸24 Hour giveaway x 5x $25k Accounts 🥶
1. Follow @ckcapitaluk_
2. Like & Retweet
3. Comment your favourite Trading Word
*Launch off of our 7 day flash promo RESETS for our amazing Traders ($29 for $10k) ($189 for $100k)!!!
🌈 HAPPY HOLI 🌈
🚀GIVEAWAY TIME🚀
🚀GIVEAWAY TIME🚀
🚀GIVEAWAY TIME🚀
🔥$2000 Funded Accounts Giveaway Today!!!🔥
🔥4 Mar Giveaway 🔥
🔥Life-changing money for many🔥
Rules:
1. Follow @cointracts x @IITian_InCrypto
2. Like & RT this post!
3. Comment, Like & RT Previous 5 post of @cointracts
4. Comment your Bitcoin Price Prediction for today at 10 pm. Closest Prediction wins! (Fair Distribution, before 8 pm)
📍Daily Result announcement here: https://t.co/reZd1uaWHG