Most traders are reading these 5 stocks completely wrong…
Here’s the one I’m studying the hardest right now $NVDA
Full breakdown is pinned above
Drop your #1 stock below — what are you watching this week? (If you want the full checklist + every level mapped for next week, comment “TRIAL” and I’ll DM it)
The Top 3 ICT Concepts Every Trader Should Master
If you're diving into the world of trading, you've probably heard of ICT. It's all about understanding how "smart money" (big institutions) manipulates the markets through concepts like liquidity, imbalances, and price inefficiencies. It's a practical way to spot high-probability setups by reading institutional footprints on the charts. In this post, I'll break down my top 3 essential ICT concepts that have given me structure and success in the markets. These are foundational to conquering the markets, based on core ideas like liquidity, imbalances, and more. I'll explain each one, why it matters, how to identify it, and tips for trading it.
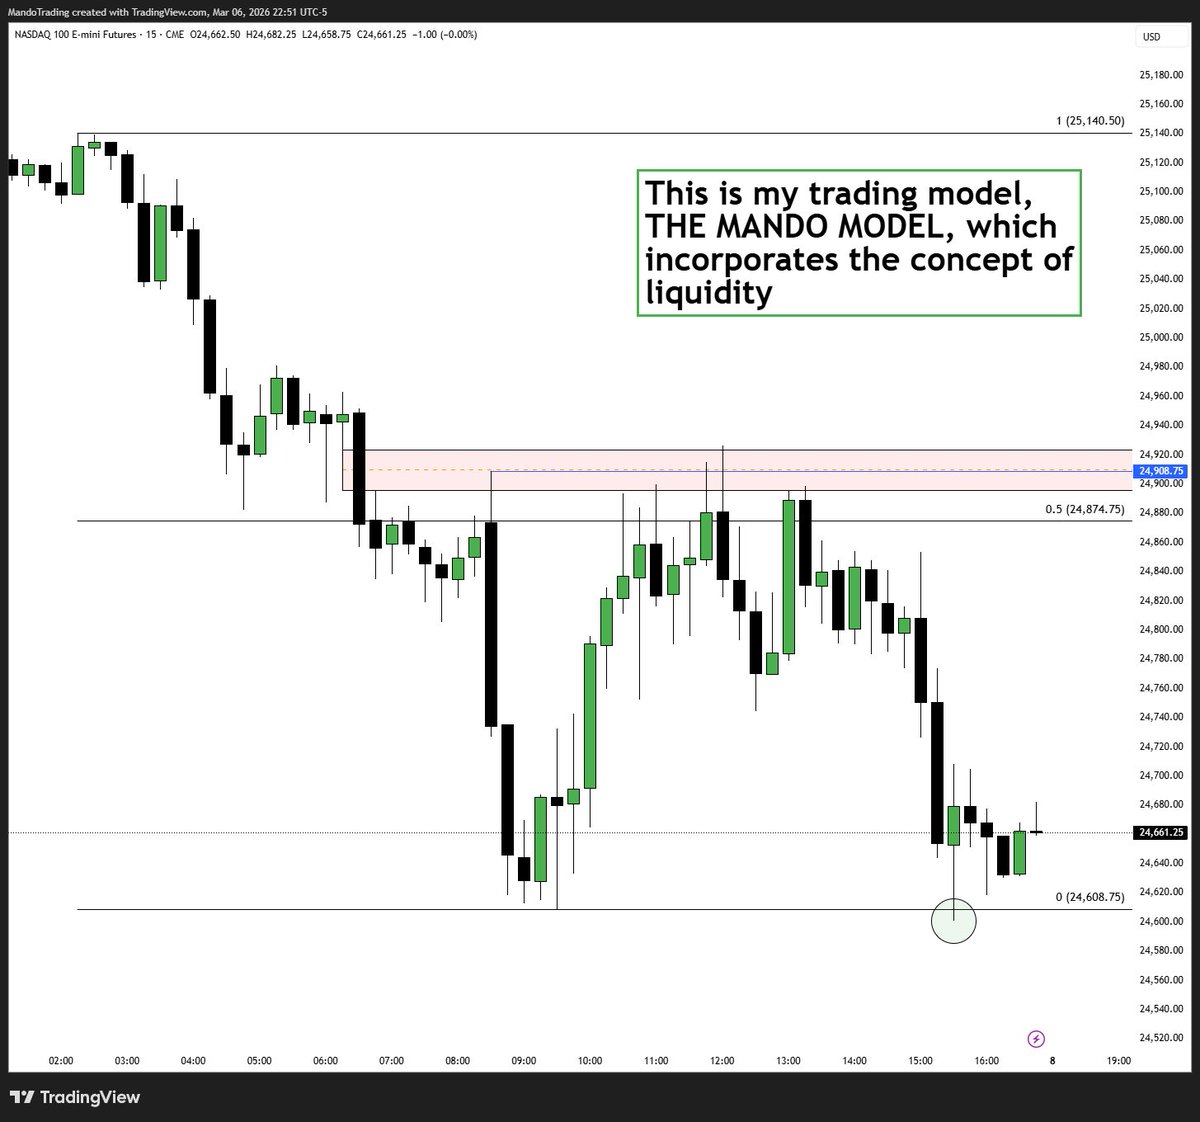
1. LIQUIDITY
Liquidity is the cornerstone of ICT concepts – it's essentially the fuel that drives price movements. In ICT terms, liquidity refers to areas where there's a cluster of stop-loss orders, buy/sell limits, or equal highs/lows that institutions target to fill their large positions without slipping the market too much. Price often moves to "SWEEP" this liquidity before reversing or continuing in the intended direction.
Why it matters: Markets don't move randomly; they seek liquidity to facilitate big trades. Understanding liquidity helps you avoid getting stopped out prematurely and instead position yourself with the smart money.
How to identify: Look for equal highs (buyside liquidity) or equal lows (sellside liquidity) on higher timeframes. Also, watch for liquidity pools around swing highs/lows, session opens, or news events. A classic sign is a "liquidity sweep" where price sweeps through these levels quickly, inducing retail traders to enter in the wrong direction.
Trading tip: In a bullish trend, wait for price to grab sell-side liquidity below a lower time frame low before looking for longs. Combine with other concepts for confluence.
The first image below shows a liquidity sweep above the blue line.
2. IMBALANCES
Volume imbalances and Fair Value Gaps, also known as imbalances or inefficiencies, occur when price moves so aggressively that it leaves a "gap" in the chart – a three-candle formation where the high of the first candle and the low of the third don't overlap, creating an unfilled area.
Why it matters: Markets hate inefficiencies; FVGs often get filled as price retraces to balance the order flow. They're great for targeting entries or exits, especially in ranging markets or after displacements.
How to identify: Scan for explosive candles (displacement) that skip price levels. The FVG is between the close of the first candle and the open of the third. The second image below will show this.
Trading tip: Use FVGs as the structure for the idea - entry, stop loss (low of the candle that created it) and target liquidity overhead or another imbalance. The Mando Model is designed to capitalize on these inefficiencies and use them to offer high probability setups and define my trade idea before I even enter
3. MARKET STRUCTURE
Market Structure and Market Structure Shifts are pivotal concepts signaling the trend and the potential for a trend change or continuation. It builds on Break of Structure (BOS) and Change of Character (CHoCH): BOS is when price breaks a previous high/low, while CHoCH is the first retracement after that break, and MSS confirms the shift with a new lower low/higher high in the opposite direction. The concept of premium vs. discount also comes from market structure, but we can save that for another thread.
Why it matters: MSS helps determine the overall bias – bullish or bearish. It's the point where smart money has likely shifted control, leading to sustained moves.
How to identify: In an uptrend, a MSS occurs when price makes a lower low after breaking structure downward (CHoCH). Use higher timeframes for major shifts and lower for entries.
Trading tip: Find lower time frame opportunities that fit the higher time frame narrative. For example, if the HTF trend is bullish, for a higher probability trade, you'd want a bullish setup to occur on smaller time frames.
I have attached an example of my model which takes all three of these principles into consideration.
These top 3 ICT concepts – Liquidity, Imbalances and Market Structure – form the backbone of smart money trading. These concepts have given me structure to my trading and have been combined to create both of my trading models, THE MANDO MODEL and ODNAM. As always, I urge you to back test these concepts for yourself, so you can see how ridiculously precise they are. Start by practicing on demo charts, combining them for confluence, and always manage risk. These concepts give me an edge over retail thinking, and that is why I am able to call the market successfully at the clip that I do.
Helpful? Let me know!
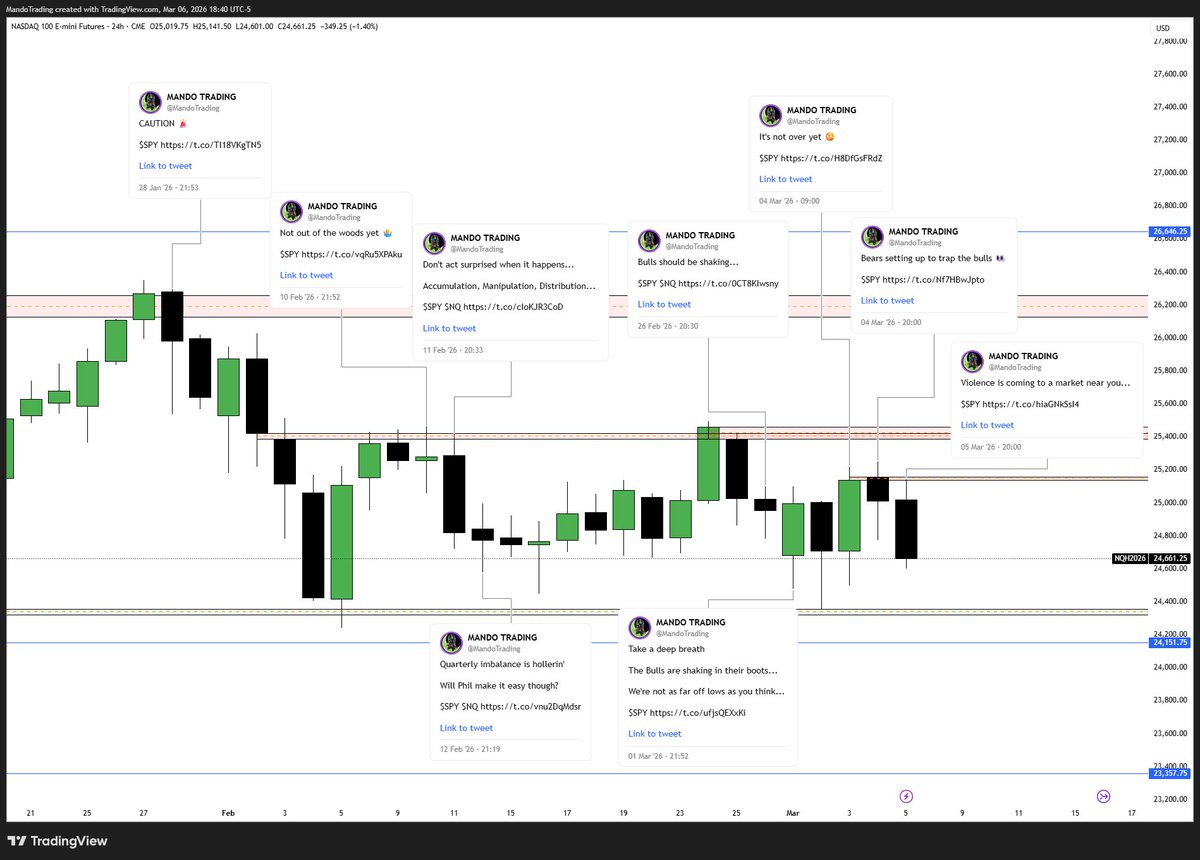
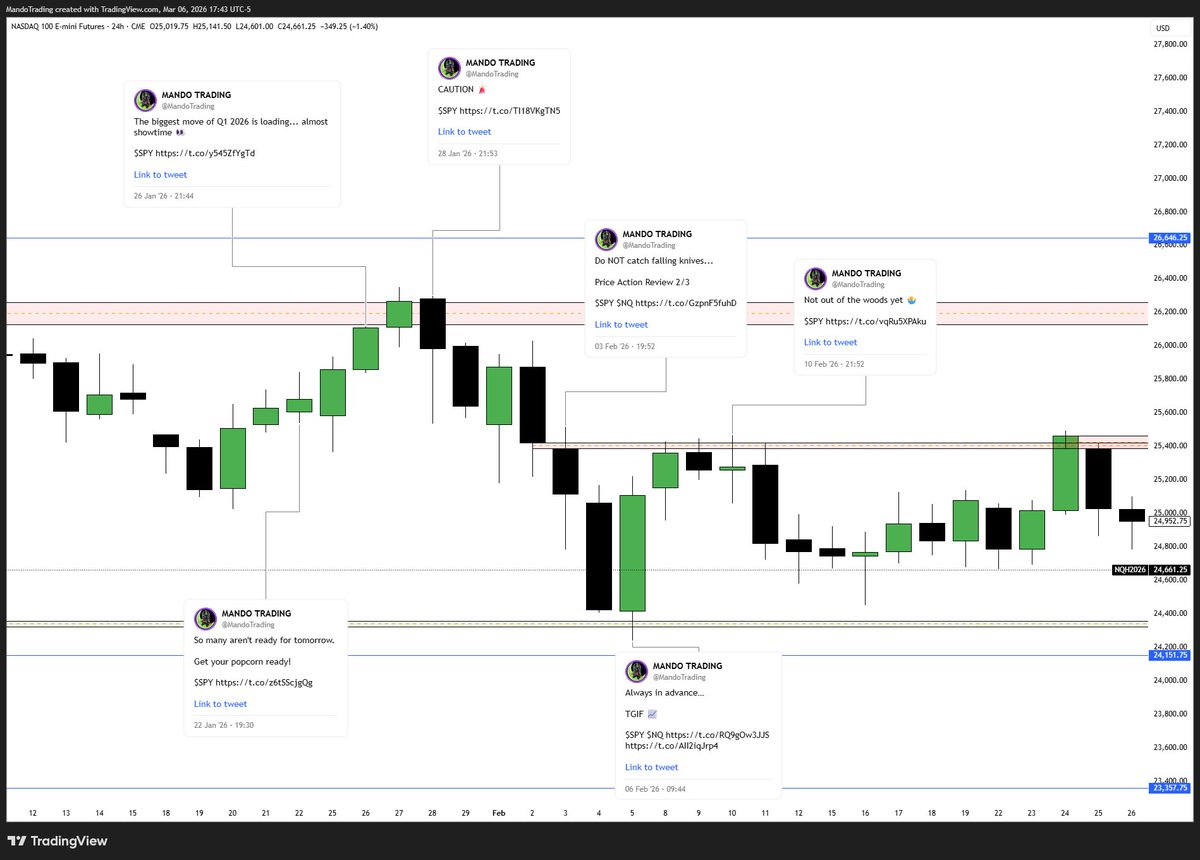
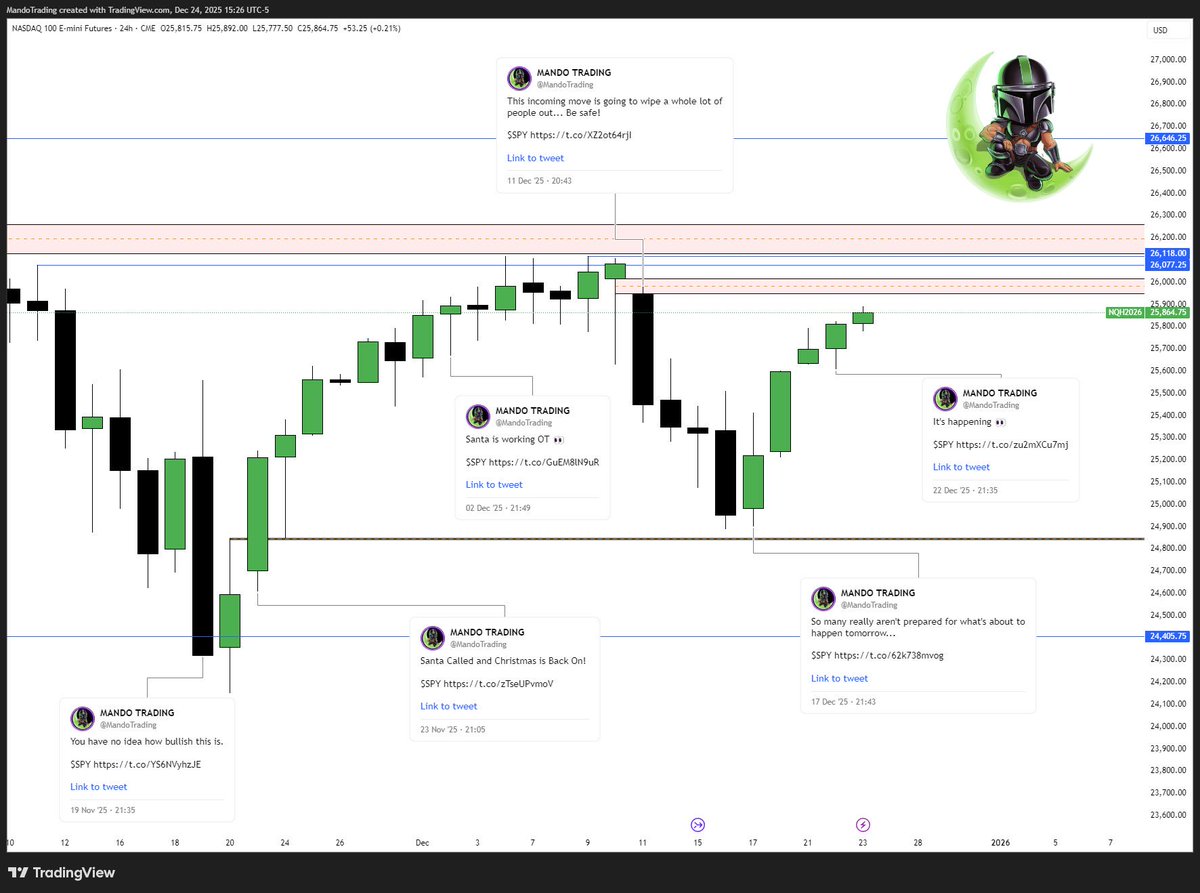
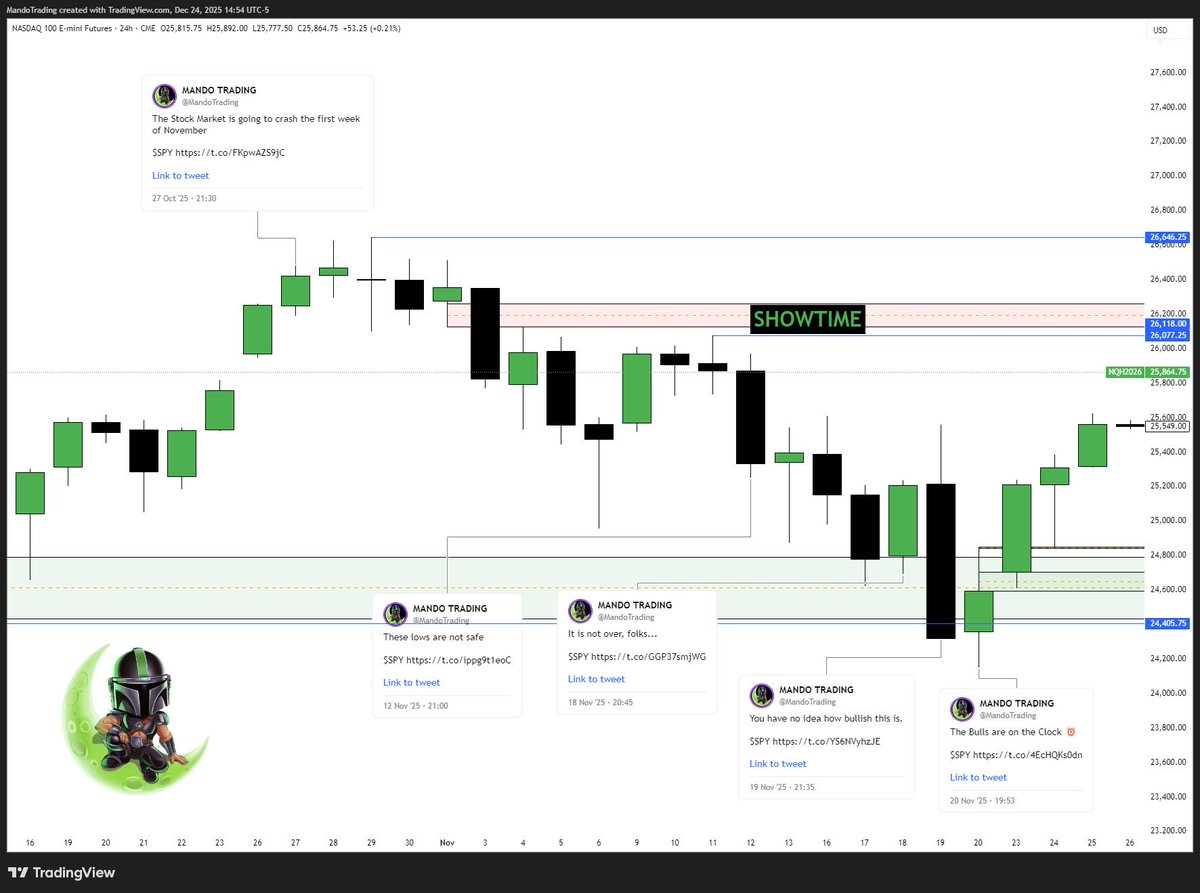
AIN'T THAT SOMETHING?
4 months of price action time stamped on X before it even happened. You can even go back and listen 😉
There's levels to this...
Learning how to read price is the best thing you can ever do.
Who has been following along this incredible run?