@OnChainCollege OCC! BTCLive member here just wondering how patterns presented here compare to around this time in the last 4 year cycle. Comparing the two time frames may support your thesis.
VIX could continue to pullback
Other charts are signaling this such as JNK and indices cutting over
BTC and TMC structurally passing
This trade looks to buy at structure(yellow box below) and ride the wave to resistance(yellow box above)
VIX could continue to pullback
Other charts are signaling this such as JNK and indices cutting over
BTC and TMC structurally passing
This trade looks to buy at structure(yellow box below) and ride the wave to resistance(yellow box above)
Failed to recognize strength across markets and structural passes that were signaling risk on in the short term
Could’ve been patient and found a better exit
Crypto is volatile and as long as other Cheatsheet charts are signaling risk on, there is no need for a quick exit
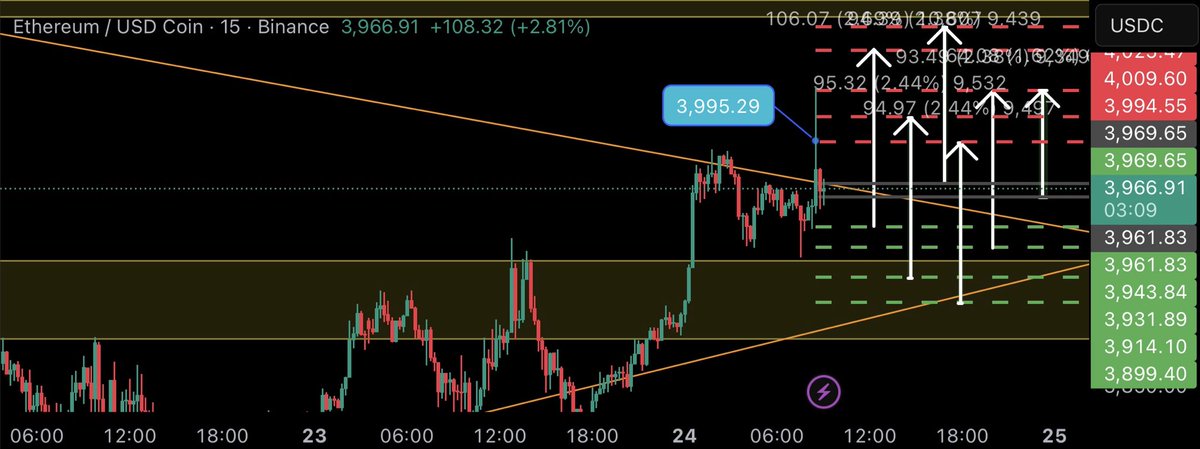
Another entry point of mine on ETH
Same principles from previous post
Strength in risk-on markets
Looking to capture a pullback before continuation of bullish momentum
#CTKS
Didn’t like price action in the moment but looking back there were signs of strength
BTC had positive momentum and was passing through structure
Exited around about breakeven marked by the red arrow
Another entry point of mine on ETH
Same principles from previous post
Strength in risk-on markets
Looking to capture a pullback before continuation of bullish momentum
#CTKS
Looks like we have some strength in risk on markets
VIX decaying, JNK cutting over, AUSSIE well supported and, Gold and Silver decay
Looks like a possible confirmation in change of trend
What do you think @StandfieldKen#CTKS
Price action is looking strong into the open but a pullback may be on the table
VIX is coming into support
BTC and TMC overhead resistance
However….
If JNK and indices stay strong we may get a break of the current downtrend
#CTKS