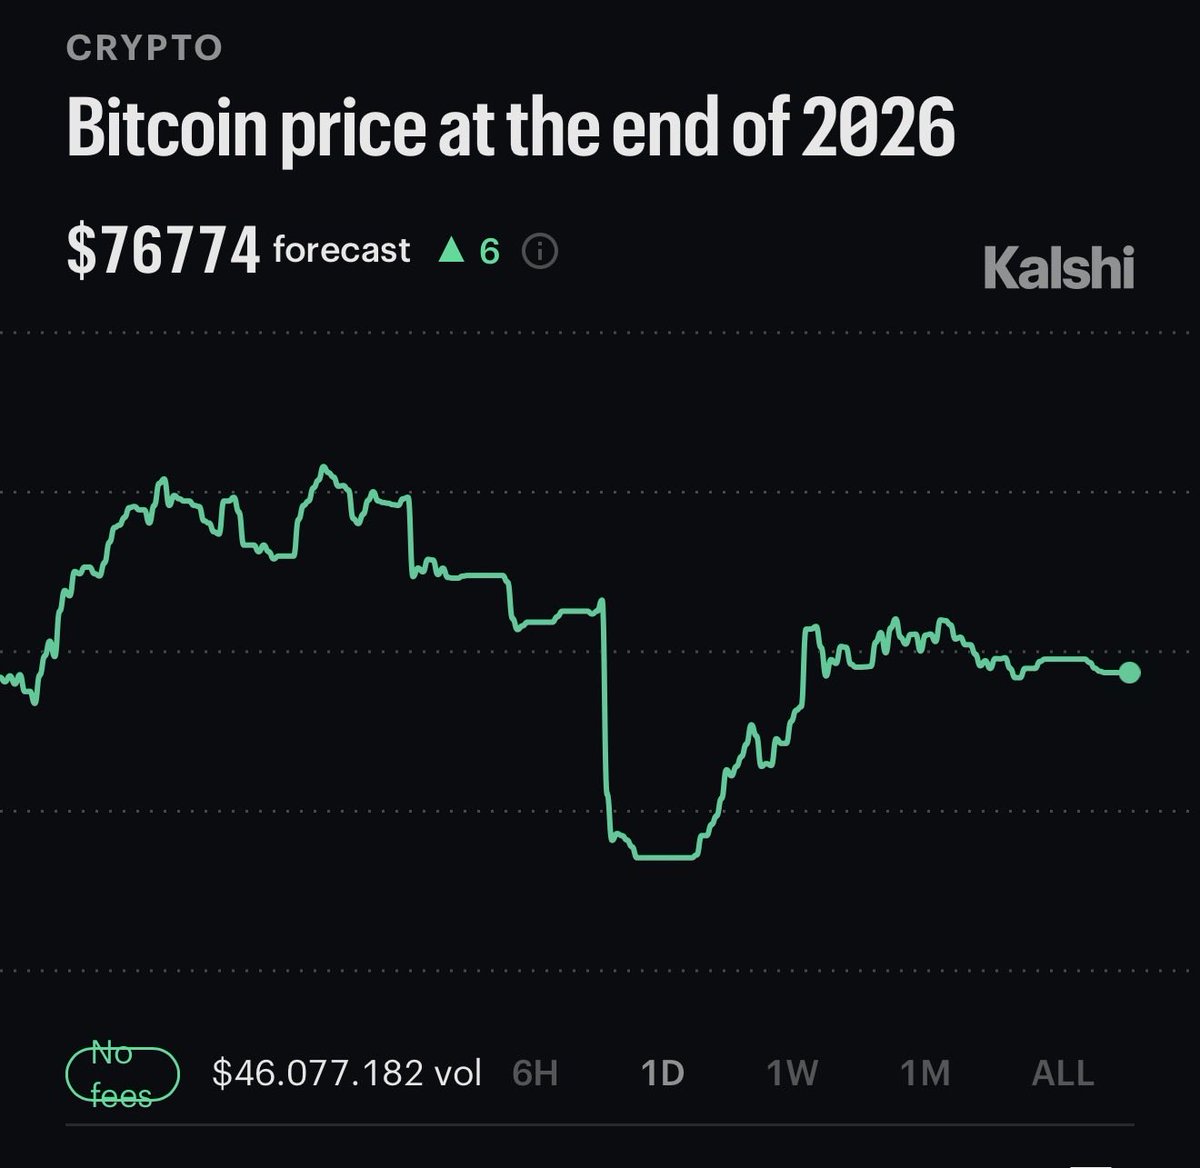
I AM ABOUT TO WALK INTO THE MOST ABUNDANT BALANCED WEALTHY AND SUCCESSFUL PERIOD OF MY LIFE. I NATURALLY ATTRACT GOOD FORTUNE, AND I AM WEALTHY IN MORE WAYS THAN ONE. I GIVE MYSELF PERMISSION TO PROSPER, AND I HAVE THE POWER TO BUILD THE LIFE THAT I DESIRE.
how is this a real company lmao
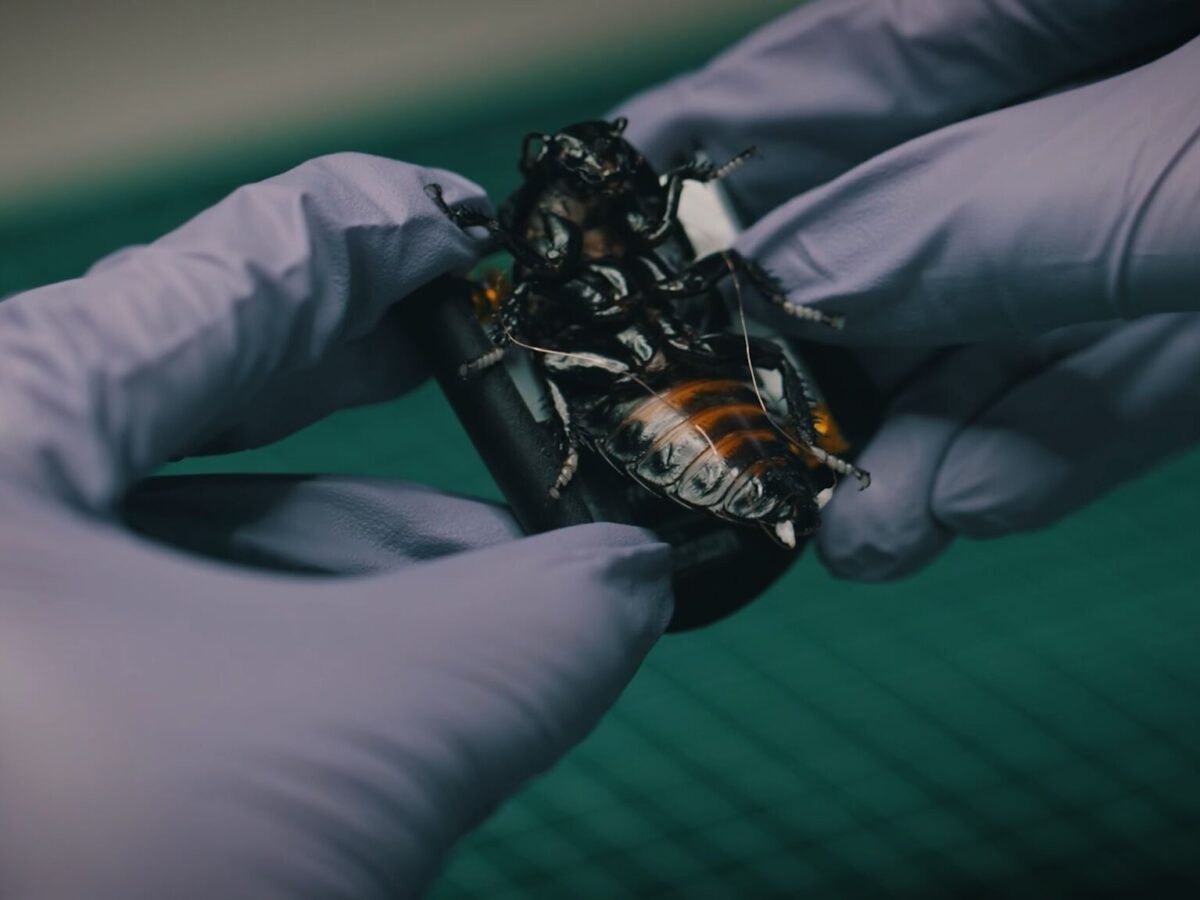
this German startup sells cyborg cockroach spies to NATO militaries
it's called SWARM Biotactics, they've raised €13M, and their website literally says it "makes living organisms programmable"
militaries want them because nobody looks twice at a cockroach
for example, a drone can't sneak into a building where enemy soldiers are hiding
but a cockroach can squeeze through almost anything
so the company straps a tiny backpack onto a live Madagascar hissing cockroach:
> the backpack can carry a camera or microphone so the bug can see and hear for you
> electrodes on its antennae let you steer it in the direction you want
> AI lets a whole group move as a swarm so nobody has to individually drive each one
the same setup could also find survivors under rubble after an earthquake
my favorite part is the CEO says the roaches aren't carrying explosives for now, but admits that could change
i have no words
TODAY: One LAST CPI to cue a year-end RALLY or a SELL OFF.
The last CPI report before the Fed’s December meeting will be out in a few hours.
There will be no official YoY reading, as the 2025 shutdown left a gap in last October’s data.
So all eyes are on the MONTHLY numbers.
Economists expect October CORE CPI to rise by 0.2% MoM, while headline CPI is projected to add 0.3%.
What today’s CORE CPI number could mean:
🟢 0.1% → COOL. Hike odds drop, stocks and Bitcoin could rise
🟠 0.2% → AS EXPECTED. December hike stays on
🔴 0.3%+ → HOT. Bigger hike risk, stocks and Bitcoin could fall
A 0.1% difference could decide between a 25 bps and a 50 bps hike.
Markets now see an 99% chance of a December rate hike, up from 67% last week.
The macro backdrop:
1. September CPI climbed to 3.7% YoY from 3.4%. Today’s monthly print shows whether that momentum carried into October.
2. Over 70% of core services categories rose at least 3% YoY. Another hot services print would signal that inflation is still widespread.
3. Payrolls rose 165K and unemployment fell to 4.1%. With jobs holding up, a hotter-than-expected core CPI would strengthen the case for a bigger December hike.
Volatility is coming.
RWA perps went from $18B to $2.23 TRILLION in one year.
That’s 122x.
Stocks and commodities are now 18% of all perp volume. A year ago it was basically zero.
Crypto feels dead right now, but charts like this say otherwise. Real usage is exploding.
🔥 UPDATE: Altcoin volume has cooled back to normal levels after it surged to 4x Bitcoin’s in September, a speculative spike that lined up with BTC’s local top near $87K, per @glassnode.
If I had $500k in crypto now, I would:
1. Go full-time crypto. Move somewhere cheap. One year to make it.
2. No BTC, no ETH, no SOL, no HYPE.
3. No memecoins. No directional leverage.
4. Allocate $250k to a delta-neutral strategy between @tradexyz and @metricxyz.
-> Short equity perps trading at a premium on tradexyz, buy the matching tokenized equities on metricxyz.
One strategy, three potential airdrops: HL S3 + tradexyz + metricxyz.
5. Allocate $50k to prediction markets on HIP-4. Market make tradfi outcomes. If options launch, be ready to arb them against a broker from day one.
6. Deposit and loop $200k of sUSDe on Aave.
-> Deposit sUSDe, borrow USDC, swap into more sUSDe. Use the net yield and some of the principal to cover living expenses.
Rotate into @acier, an upcoming lending protocol, when it's live.
7. Build AI apps on @flop_labs during testnet.
-> Vibe code your own apps. Use free testnet inference to get your first users and position yourself for the FLOP agent airdrop.
The goal: stay consistent and optimistic while positioning myself for potentially huge airdrops.
One year. Locked in.
Something interesting is happening with Bitcoin on chain right now.
In early October, 97.5% of short-term holder supply was in profit. By November 4, that had collapsed to just 38%.
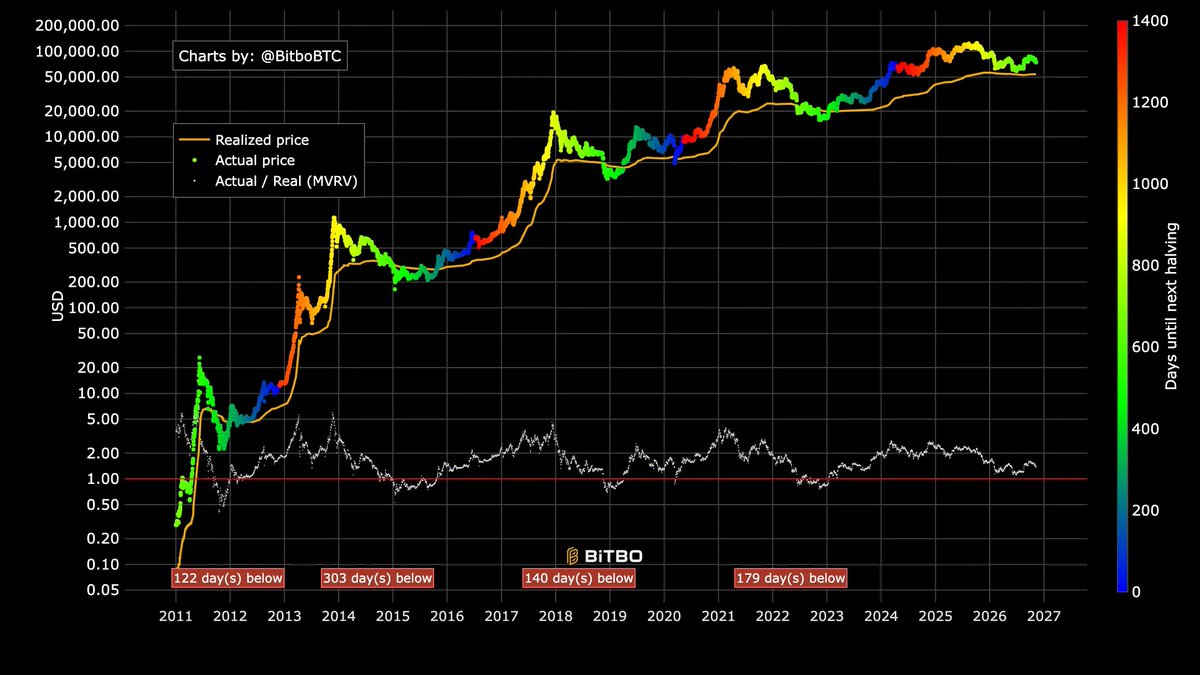
Now look at Bitcoin's key on chain cost bases:
- Short-term holders: $75.8K
- True Market Mean: $77.6K
- Overall Realised Price: $54K
With BTC around $74K, the average recent buyer is underwater, but price remains well above the broader market's realized cost basis. Here's where it gets interesting, in both the 2018 and 2022 bear markets, Bitcoin spent months trading BELOW its realized price during capitulation.
We haven't seen that this cycle. So are we seeing a structurally stronger market entering re-accumulation, or is the real capitulation still ahead?
Personally, I want to see BTC reclaim $75.8K to $77.6K before getting too excited.
The data is interesting, but the bottom isn't confirmed just yet, there is always still a possibility of bearish scenarios and a smart trader / investor is aware of this.
JUST IN:
Michael Saylor bought $78 Million worth of Bitcoin last week
Strategy now holds $63.5 Billion worth of BTC and is down almost $1 Billion
Imagine started buying BTC at $12K and still being down when the price is 6x higher
WILL A BLACK MONDAY CRASH HAPPEN TOMORROW?
After last week's bloodbath, people are wondering whether Monday open could be brutal for the markets.
And they have reasons for that.
- Democrats win have created a fear in AI stocks.
- Global AI bubble is popping.
- US is launching mini strikes on Iran again.
- VIX had its 3rd biggest daily spike in history last week.
- Big funds are rapidly exiting the AI debt.
- Odds of a Fed rate hike are surging again.
Also, the Friday bounce was mostly shorts covering, and there's still a lot of fear in the market, so we could see another selloff again.
Now, what I mean by a Black Monday crash is not something that happened in 1987, but more like what we saw this Thursday.
Will it happen again?
How to trade the liquidation levels?
The short term crypto market prices are almost entirely controlled by perpetual futures exchanges aka casinos. They sell bets against crypto prices to gamblers and offer magnified gains using leverage multipliers. But there is a liquidation level. If this level is crossed the gambler gets liquidated and the casino takes all their collatoral. On a large liquidation day this is $billions in liquidations.
Note: The casino will manipulate the prices to "flush" these gamblers in high leverage bets. This is how the exchanges make their money. It is easy for the Centralized Exchange casino to do this using wash trading which is unregulated. They simply buy or sell synthetic crypto on their order book, either themselves via spoofing, or via external market makers.
Rough guideline: The red lines get flushed several times a day, the yellow lines once a week, the blue lines once every 3 weeks.
The liquidation level chart shows the overleveraged trader liquidation levels. (These are gamblers, not spot holders). Gamblers use leverage perpetual futures on Centralized Exchanges and Decentralized Exchanges to magnify gains using multipliers. The standard multipliers offered by the casinos are:
100x - Red Lines - these are liquidated if the price moves 1% against the gambler.
50x - Yellow Lines- these are liquidated if the price moves 2% against the gambler.
25x - Blue Lines- these are liquidated if the price moves 4% against the gambler.
How do you use this edge as a trader? You set limit orders where these gamblers will be liquidated and exit your trade when the highest concentration of gamblers have been liquidated. Then you set a new trap again and wait.
This is a trap strategy. You set traps and wait for the manipulation to flush the leverage and pick you up. Your exit should be fast for red line scalping, you can remain in position longer for yellow line scalping and even longer for blue line scalping, but the wait will be longer.
The purple lines indicate the levels where liquidations will most likely begin and end.
Follow along. Learn, observe and start beating the casino at their own game.
Subscribers get the levels and signals constantly and the Streamed 4k chart.
Use my referrals in my link tree to trade along.
(Not financial advice - this is gambling - the market can shift violently at any time - trading is a game of probability - there are no guarentees)
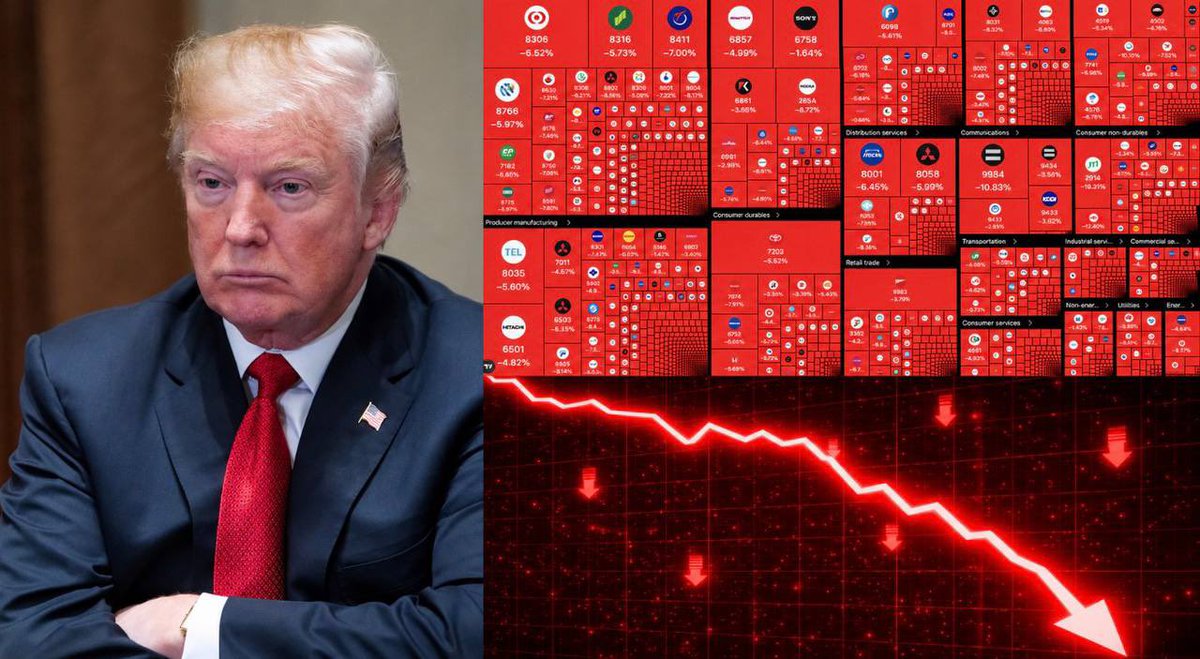
Only ONE of the top 4 major Asian markets has escaped bear-market territory.
India’s Nifty 50 just posted its best week since 2021 being a major “anti-AI trade."
6 month benchmark returns:
🇮🇳 India · Nifty 50 +2.9%
🇨🇳 Shanghai Composite Index · SSE -12.36%,
🇯🇵 Japan · Nikkei 225 −3.5%
🇰🇷 South Korea · KOSPI −31.5%
The Indian index rallied 10.8% in past two weeks with a massive influx from foreign investors to close at its highest level in over 8 months.
Over those same two weeks-
🔻Taiwan -13.8%,
🔻South Korea -8.8%
🔻and Japan -8.4%.
Japan and Taiwan both closed more than -20% below their peaks, joining South Korea in bear-market territory.
The Nifty sees little direct exposure to the falling chipmakers.
If you're bullish on AI (I'm not) this should be a generational once in a lifetime buying opportunity.
Market is completely dislocated and automated mechanical selling is driving these names down.
Tempting
JUST IN: 🇺🇸 Samsung Wallet officially launches $USDC crypto stablecoin trading and transfers for 82 million compatible Galaxy devices in the US.
BULLISH
hot take:
from what ive seen on the timeline it looks like democrats will go after ai companies and slow data center build outs so all those trillions of dollars will flock back to strong companies that aren’t super into ai
based on the vibes right now eli lily looks like it’s gonna become the next apple in the sense that it’s a safe haven asset that all the late micron, skhynix, intel, neo clouds money can flock into
We were taught that Earth orbits the Sun in a closed circle. In reality, Earth has never returned to the same point in space once in 4.5 billion years.
Right now, the Sun is carrying Earth and every planet around the center of the Milky Way at 230 km/s (828,000 km/h), more than 18,000 kilometers every 80 seconds.
Because the Solar System is tilted 60.2° to the galactic plane and bobs up and down through the galactic disc roughly every 30 million years, the planets trace open 3D corkscrew helices across deep space rather than flat loops.
The last time the Sun stood where it stands today, one Galactic Year (230 million years) ago, the very first dinosaurs were only beginning to appear on Earth. Since forming 4.6 billion years ago, our Sun has completed only 20 laps.