See more about our student projects, updates from our courses and more! Profs: @johntstasko @EndertAlex @PoloChau @friendly_cities @thecindyxiong @yalong_yang
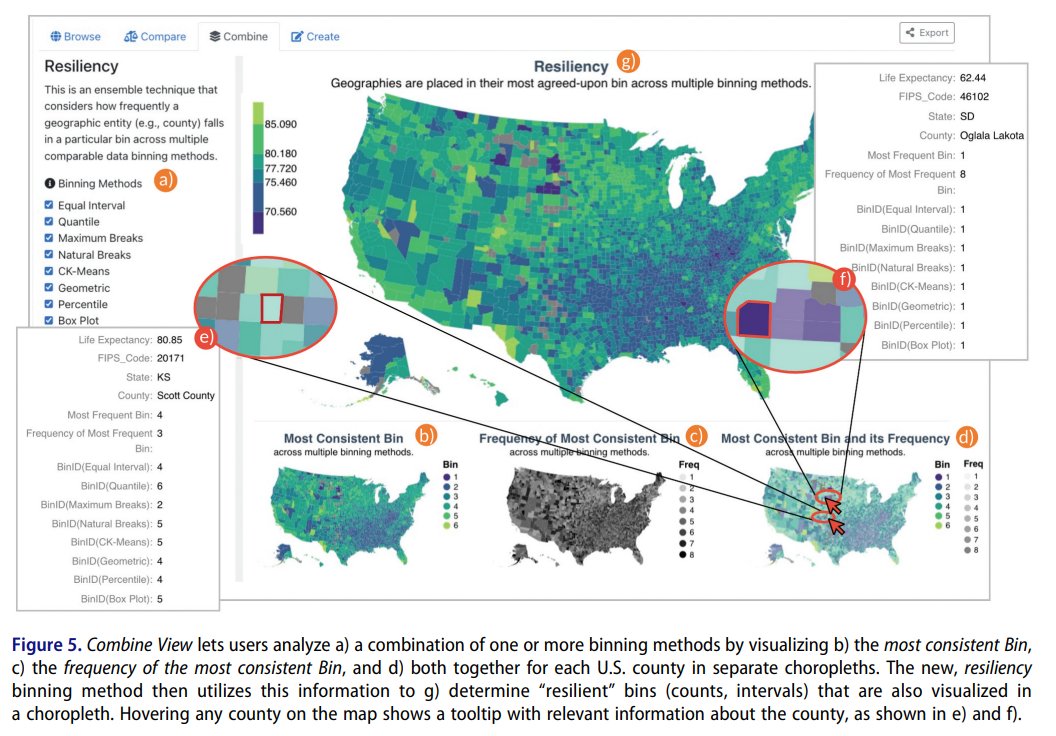
New article! A fantastic new tool Exploropleth: exploratory analysis of data binning methods in choropleth maps https://t.co/NAIxZwarej #GISchat Check out their website https://t.co/Vta6W8SWFd and video of the tool in action: https://t.co/vjQ6dEUxLQ @GT_Vis@DataVisards
Our paper “LitForager: Exploring Multimodal Literature Foraging Strategies in Immersive Sensemaking” has been accepted to #ISMAR2025 as a #TVCG paper! 🎉✨
Excited to share our new #UIST2025 paper, "OnGoal: Tracking and Visualizing Conversational Goals in Multi-Turn Dialogue with Large Language Models"! 🎉
We developed a brand new chat UI that helps users better manage their goal progress in long conversations with LLMs 🚀
What an amazing time at VisGiving 2024! 🦃 Thanks to all the friends and family who joined us for a wonderful Thanksgiving dinner full of good food, great conversations, and even better company! Until next year! ✨
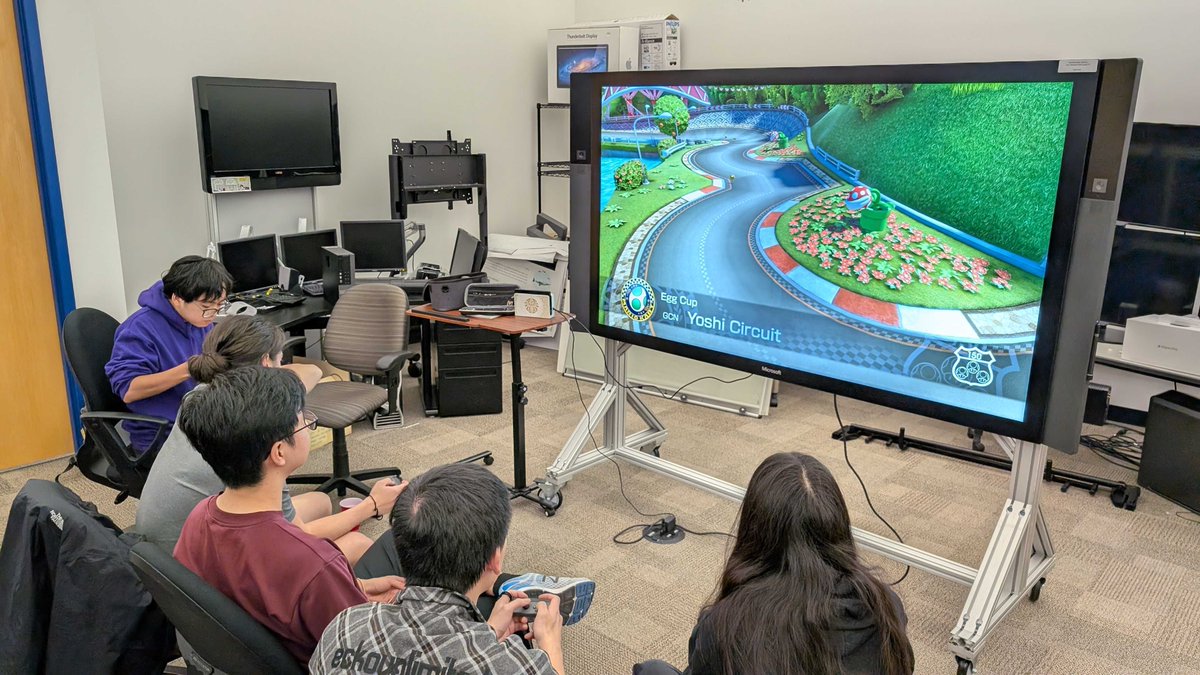
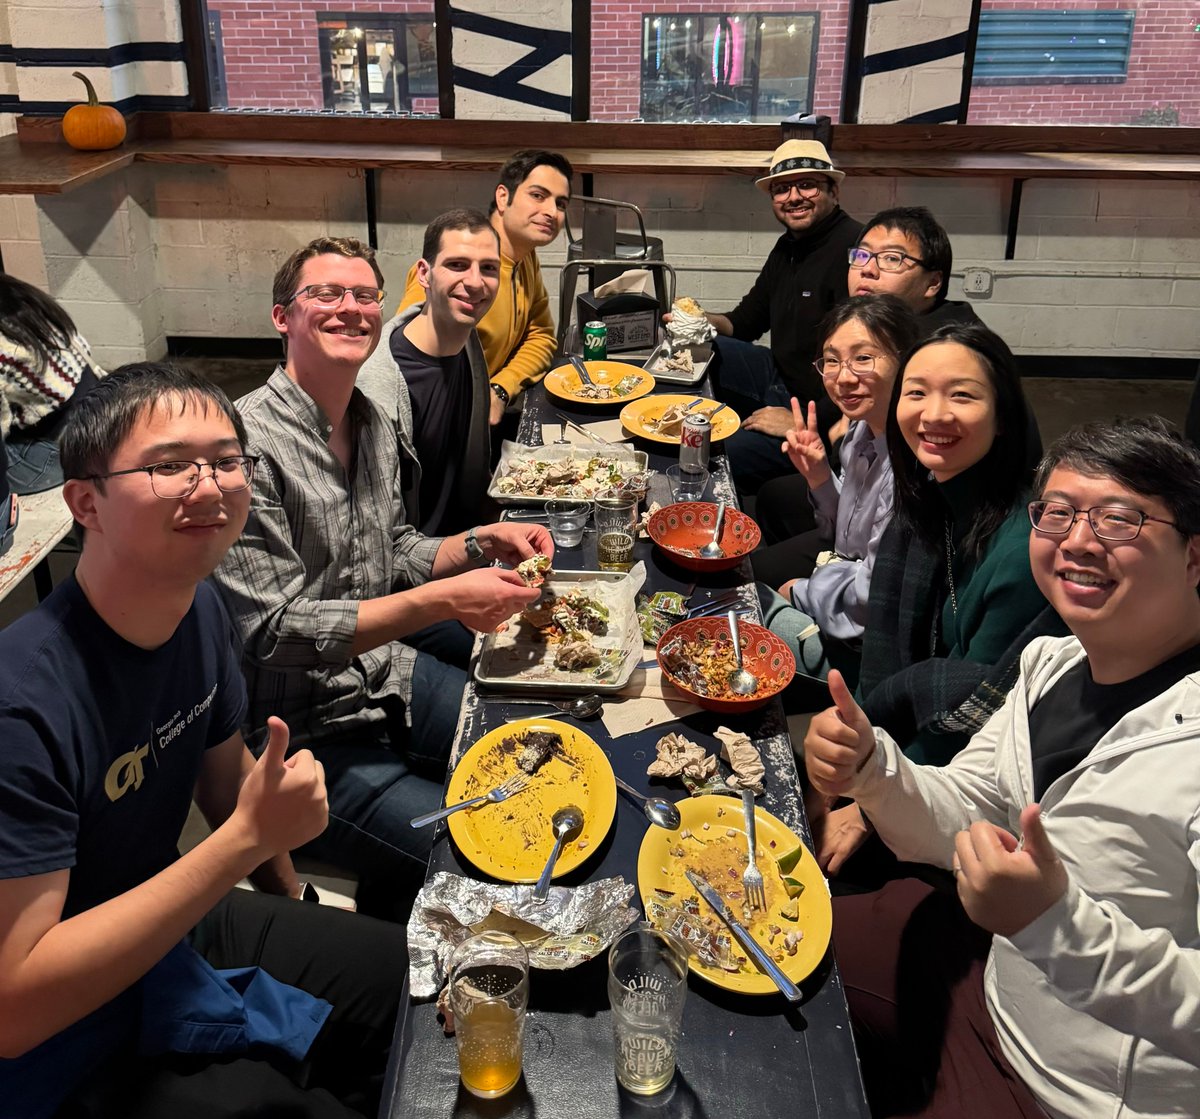
📊🌟 We had a great time last week with the folks at Emory via some Atlanta VIS meetups during #VIS2024! Sharing pics from one of our watch parties and the ATL VIS banquet @ieeevis
This could be the future of how power grid operators monitor and analyze data. Introducing ChatGrid, a large-scale visual analytic tool with a natural language query-based interface empowered by LLMs. Designed by @jin_sichen and @PNNLab.
https://t.co/xLiFoVw4eE
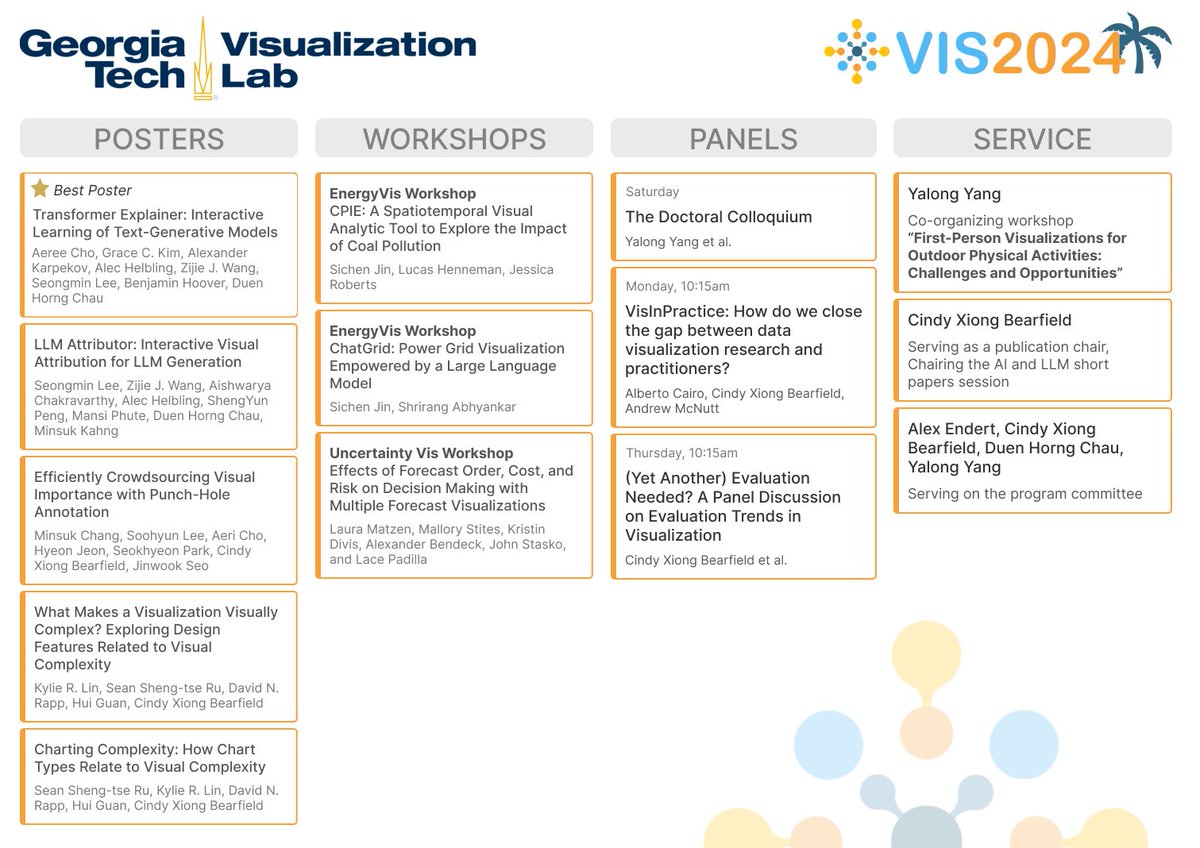
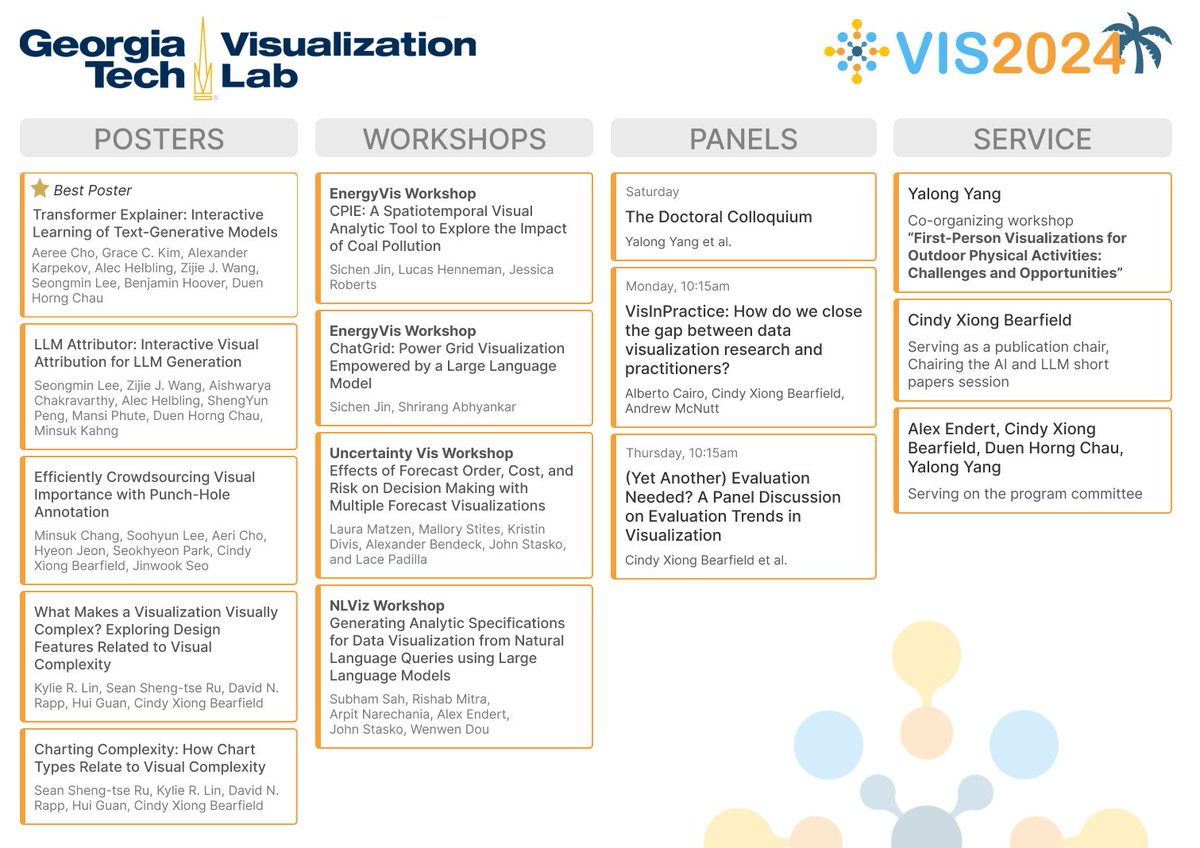
CSE Prof. @PoloChau and his group are presenting two papers and two posters this week at @ieeevis!
Check out the interactive graphic 🔗👇 for a peek of all Georgia Tech research presented this week, including award-winning work on Transformer Explainer!
https://t.co/tGlZmiIf3F
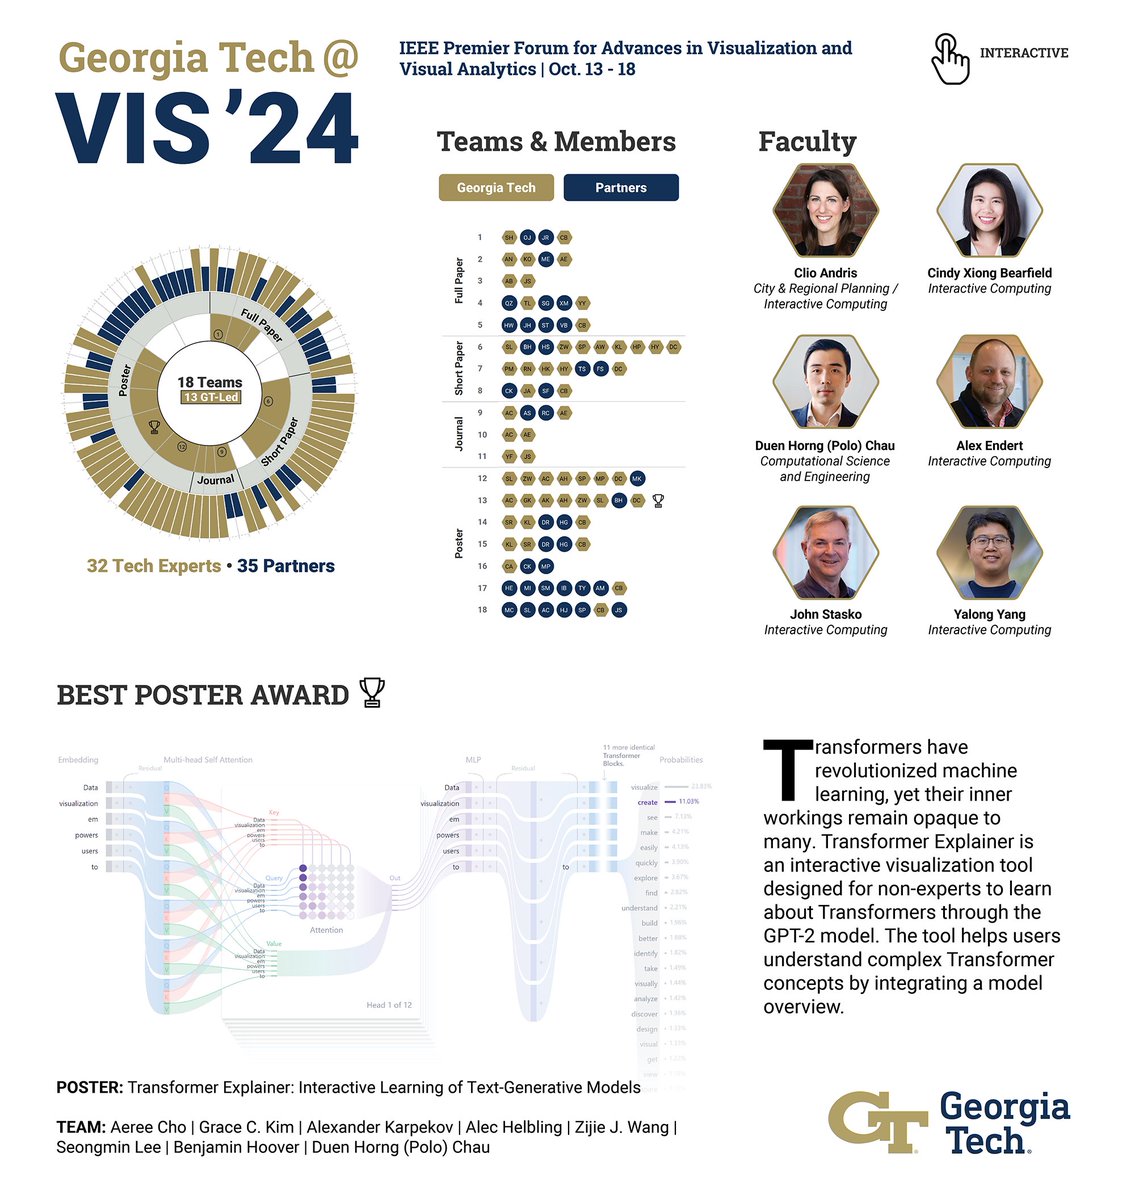
Congratulations to all the teams at @ieeevis that are making data accessible, informative, and beautiful. Eighteen @GeorgiaTech teams have new innovations in visual analytics at the conference, Oct. 13-18.
We created our own dynamic interactive visuals to show the people and work. Our lead faculty include Clio Andris (@Friendly_Cities), Cindy Xiong Bearfield (@thecindyxiong), Duen Horng (Polo) Chau (@PoloChau), Alex Endert (@EndertAlex), John Stasko (@johntstasko), and Yalong Yang (@yalong_yang).
BIG KUDOS to the team securing the conference's single Best Poster Award! Chau and his students pull the curtain back on the inner workings of Transformers—the tech that helped spur the #AI race—and show why they are so revolutionary.
INTERACTIVE CHARTS📊: https://t.co/QI2MvdgWtt
Excited to be presenting two papers next week–one at #UIST2024 on Wednesday (my first UIST!) and one virtually at #ieeevis on Thursday. Please make sure to check out the amazing work from my labmates @GT_Vis and our collaborators at VIS too!
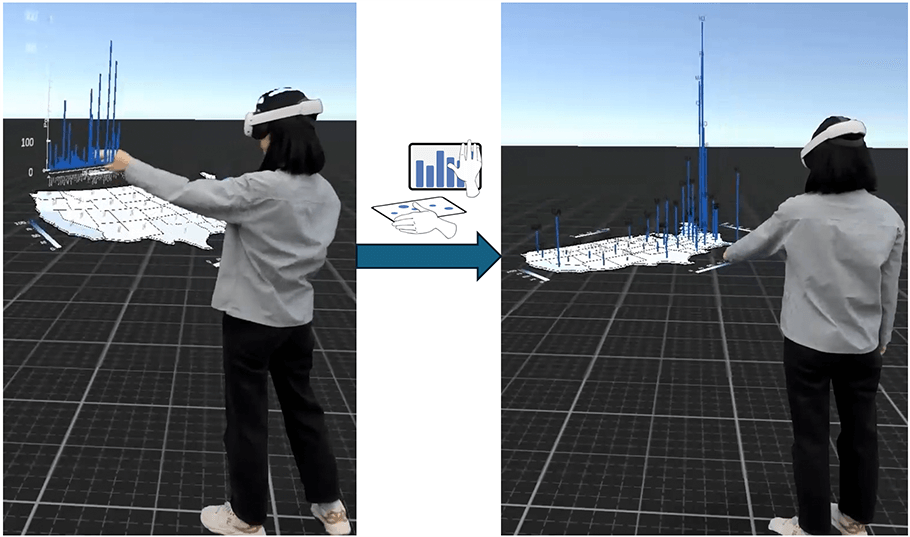
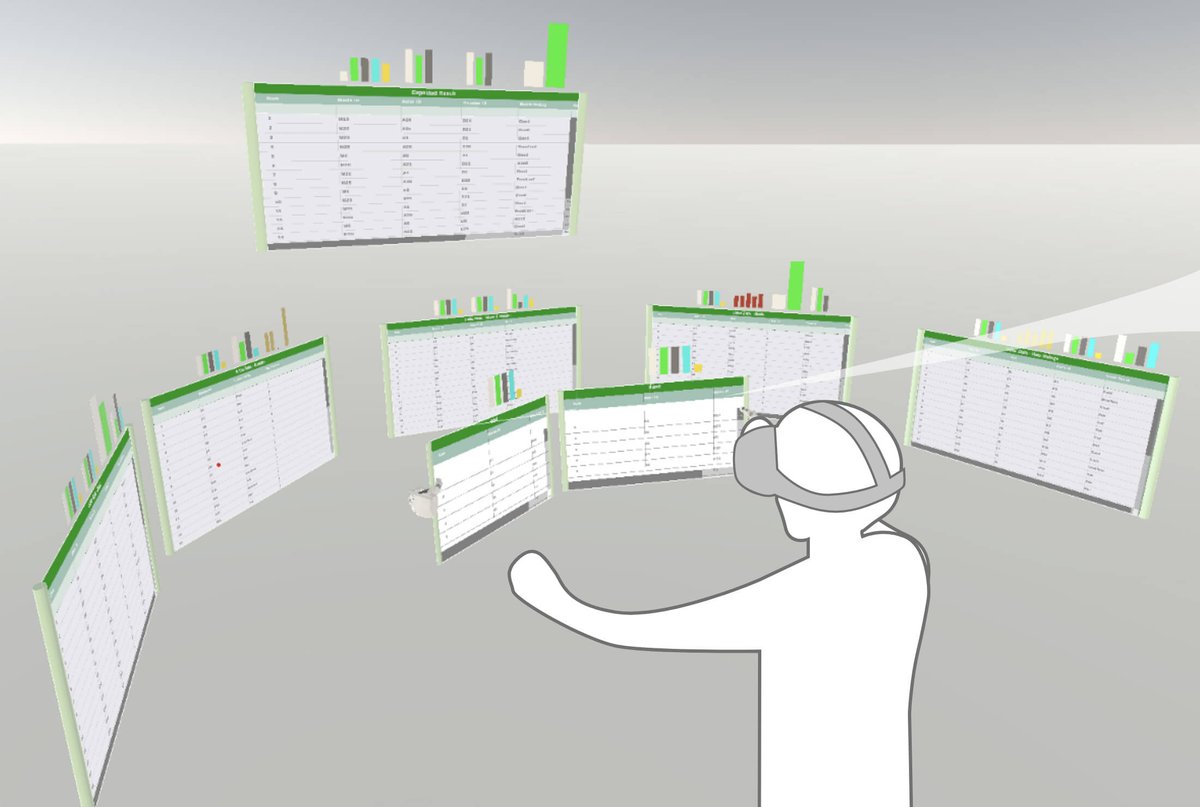
In @ieeevis, we are going to present two projects related to VR/AR, VIS, and HCI: my first Ph.D. student, Sungwon, will present our embodied data transformation system in VR, and @qian_hci led a project about compositing multiple VIS into one in VR. @GT_Vis@gtcomputing@ICatGT
📢 Want to track and visualize user interactions with sliders🎚, dropdowns 🔽, radio buttons 🔘, and checkboxes ☑️?
We made 👣ProvenanceWidgets👣, a library of UI control elements to track and dynamically overlay analytic provenance.
@ieeevis#ieeevis#ieeevis2024 👇 (1/n)
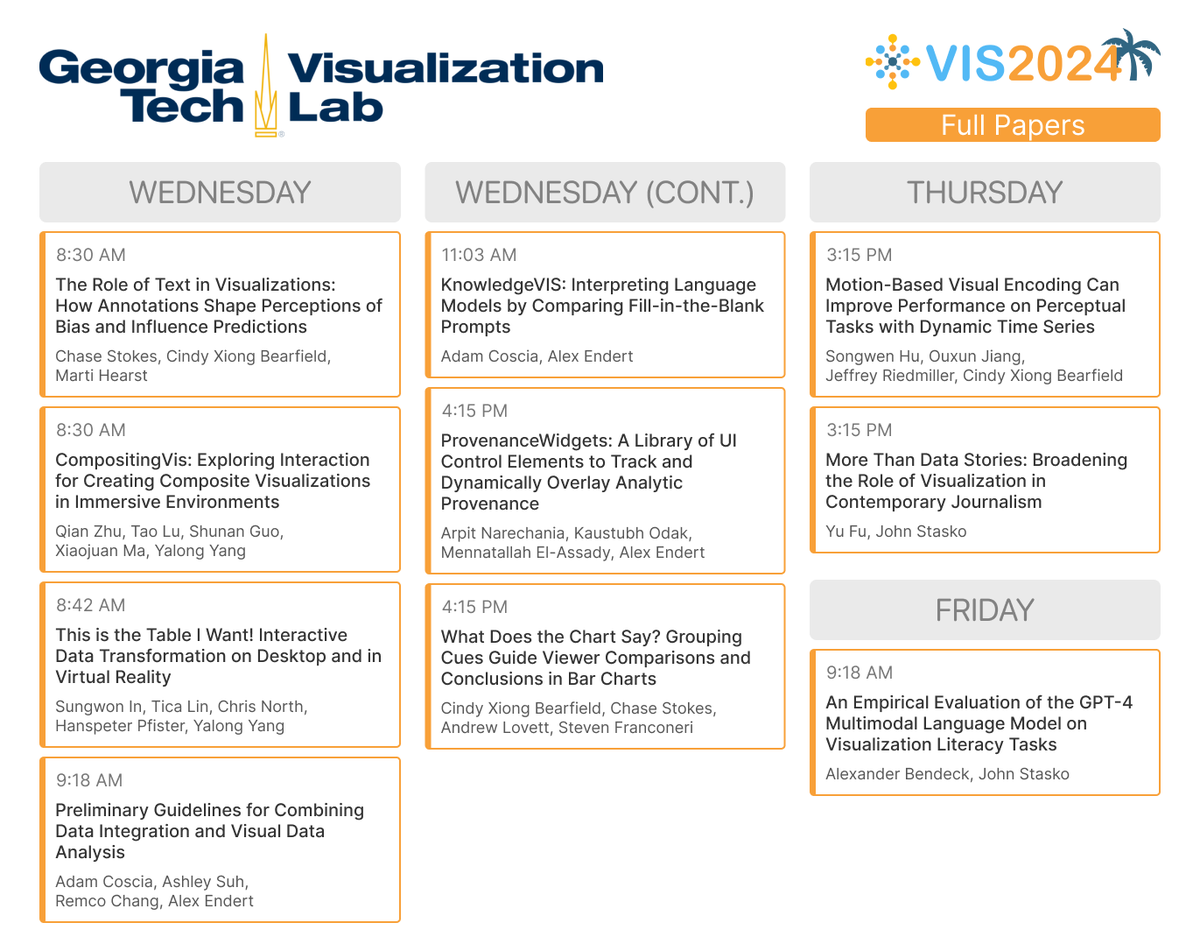
Hello, #ieeevis! We're excited to share our work from @GeorgiaTech at this year's @ieeevis conference. Check out our papers, posters, and more at #VIS2024
Naturally, we had to hop on the bandwagon as well! Thrilled to release a new v3.0.0 of NL4DV (https://t.co/IctxioU5Xt)! NL4DV now supports a ‘GPT’ mode, powered by @OpenAI#LLMs, with an ~23% increase in accuracy over previous versions.
@nlvizworkshop@ieeevis 2024
A new visualization tool designed by @AdamCoscia is helping a team of oceanographers and microbial ecologists chart and collect richer sediment samples from the oceanfloor. An amazing @acm_chi paper collaboration with @Caltech@MBARI_News@NASAJPL 🌊📊
https://t.co/Mn3tmDn74q
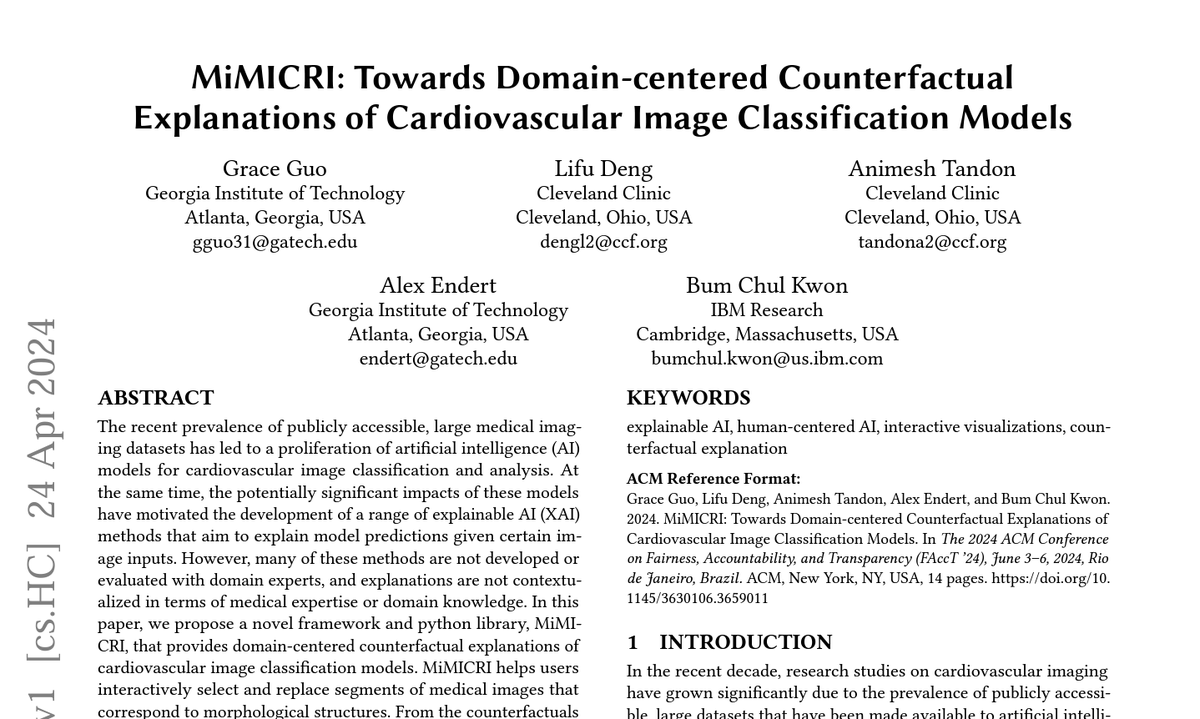
Counterfactuals explain and reduce over-reliance on AI in clinical settings, but how do we create counterfactuals for images like MRIs? And can we ensure their domain relevance?
In our new #facct2024 paper (/w Lifu Deng @ATandonMD @EndertAlex@BCKwon), we present MiMICRI (1/6)
Excited to share my #CHI2024 paper w/ @NASAJPL! 🚀
How can visualizations support fieldwork-driven research in the deep ocean? 🌊
We built DeepSee, a novel tool for visualizing prior fieldwork samples, helping scientists decide where to dive next! 🗺️
👉 https://t.co/e3Rgc7jVI2