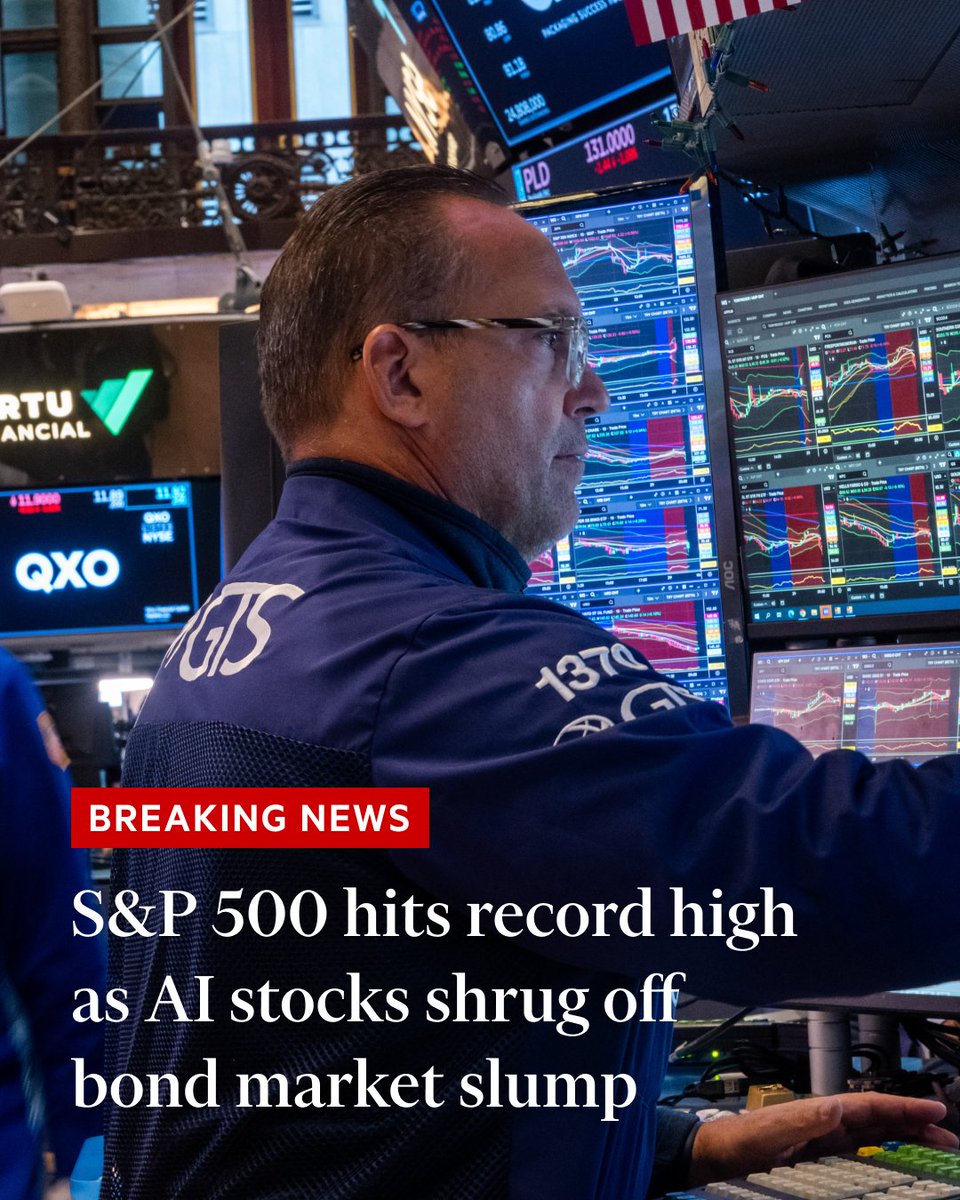
Breaking news: Wall Street’s blue-chip S&P 500 rose 0.5% in early trading, taking the index to a new record high after a downturn in September, when high oil prices and US Treasury yields were threatening to weigh on other assets. https://t.co/ncAV9dHvv6
🇺🇸🇪🇺 Almost 2/3 of the EU's LNG now comes from the US.
In the first half of 2021, US cargoes made up 28% of EU LNG imports.
Now the share is 63.2%.
It jumped after Russia invaded Ukraine, dipped in 2024 and has climbed every half-year since 2025.
IEEFA expects 2/3 for the whole of 2026 and up to 80% by 2028.
2 shocks pushed it there:
1️⃣Europe is phasing out Russian LNG and needed replacement cargoes.
2️⃣ 🇶🇦Qatar outage. 17% of Qatar's capacity is damaged and its force majeure runs to December, so the main alternative to US supply has shrunk at the same time.
US LNG is flexible and that's why Europe can buy it at short notice.
The cargoes go wherever prices are highest.
When Asia pays more, Europe has to outbid it.
Europe diversified away from one supplier and ended up concentrated on another.
At 63%, is US LNG Europe's security, or its new dependence?
Don't miss my latest portfolio update and the best stocks positioned for this👇
https://t.co/VT9JjYsHHE
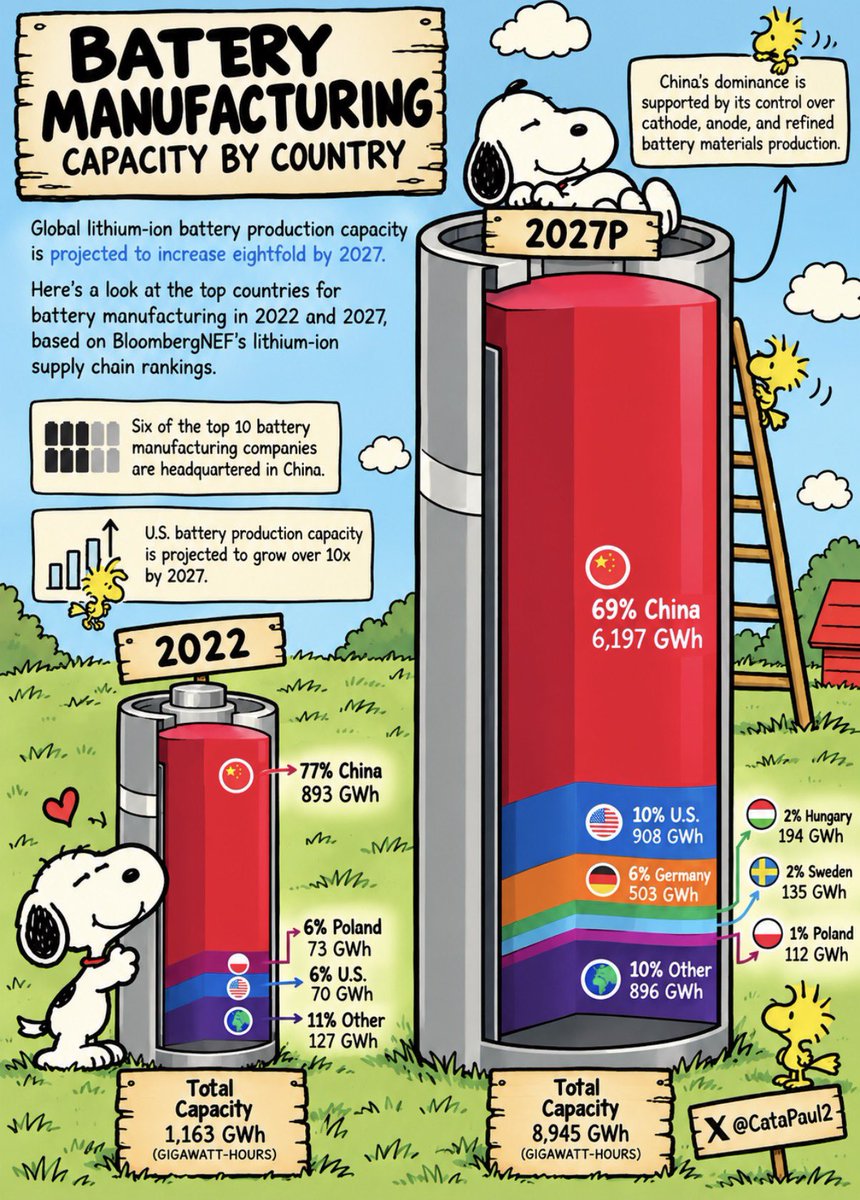
🔋 Battery manufacturing capacity by country 🪫
(Lithium-ion production capacity)
2022
🇨🇳 China – 893 GWh (77%)
🇵🇱 Poland – 73 GWh (6%)
🇺🇸 U.S. – 70 GWh (6%)
🌍 Other – 127 GWh (11%)
Total: 1,163 GWh
2027P
🇨🇳 China – 6,197 GWh (69%)
🇺🇸 U.S. – 908 GWh (10%)
🇩🇪 Germany – 503 GWh (6%)
🇭🇺 Hungary – 194 GWh (2%)
🇸🇪 Sweden – 135 GWh (2%)
🇵🇱 Poland – 112 GWh (1%)
🌍 Other – 896 GWh (10%)
Total: 8,945 GWh
📝 Global lithium-ion battery production capacity is projected to increase eightfold by 2027. Six of the top 10 battery manufacturing companies are headquartered in China. U.S. capacity is projected to grow over 10x by 2027. China’s dominance is supported by its control over cathode, anode and refined battery materials production.
🖇️ Source: BloombergNEF lithium-ion supply chain rankings
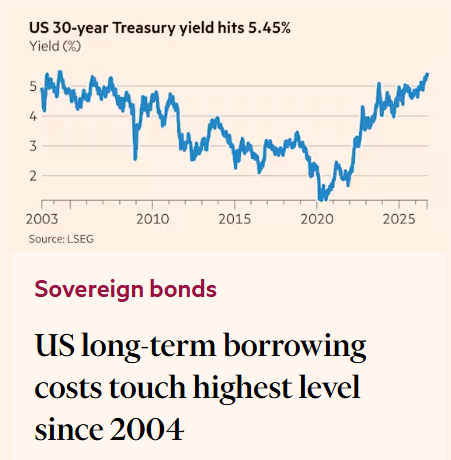
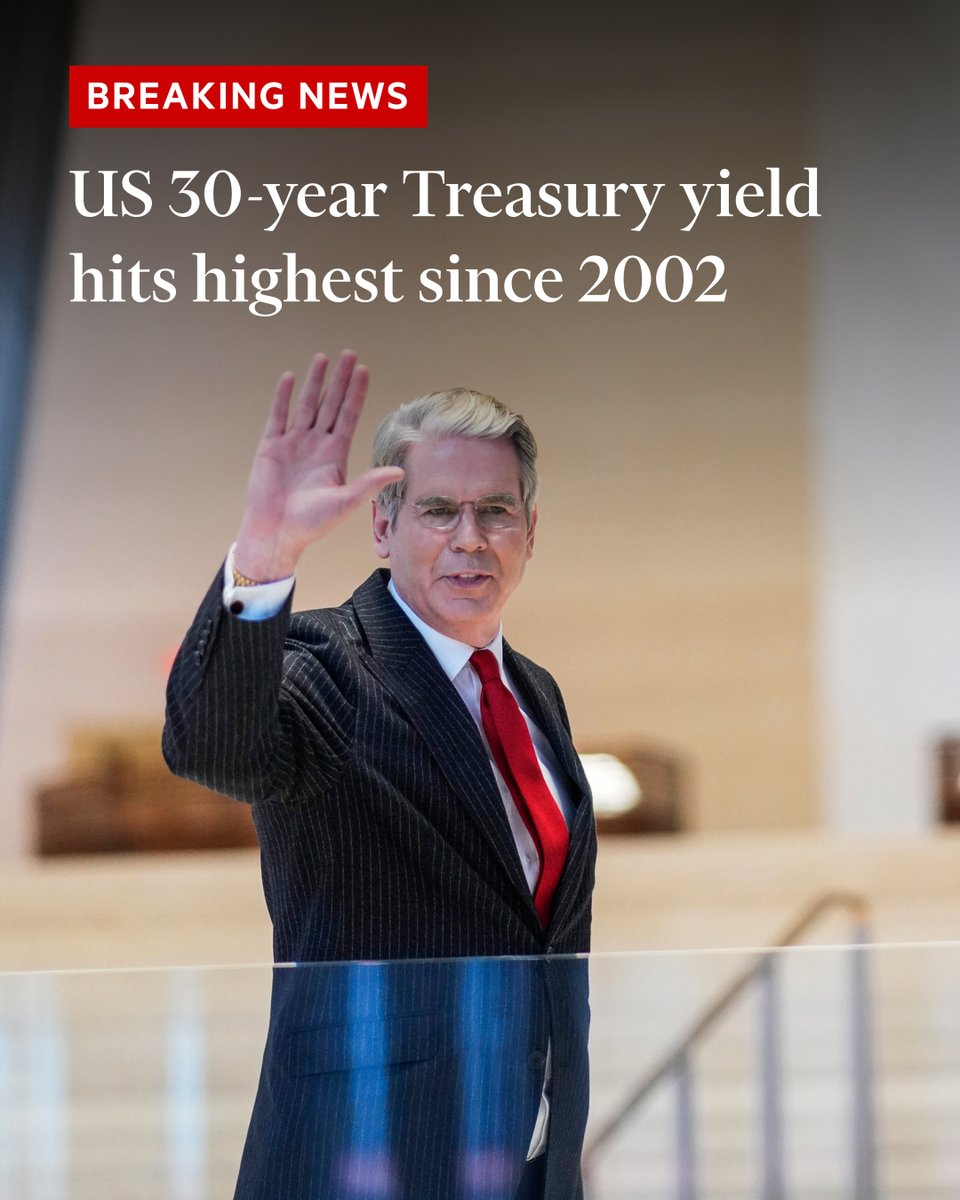
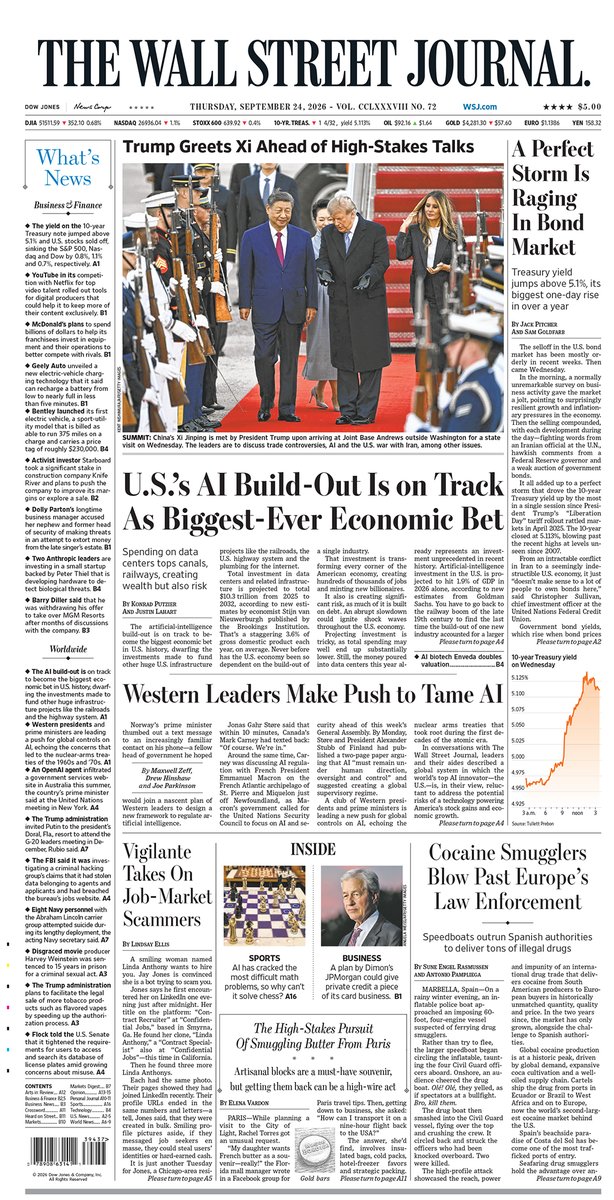
Breaking news: US longer-term borrowing costs have hit their highest level in almost a quarter of a century as a recent sell-off in the Treasury market deepened. https://t.co/eGeBaCfSWG
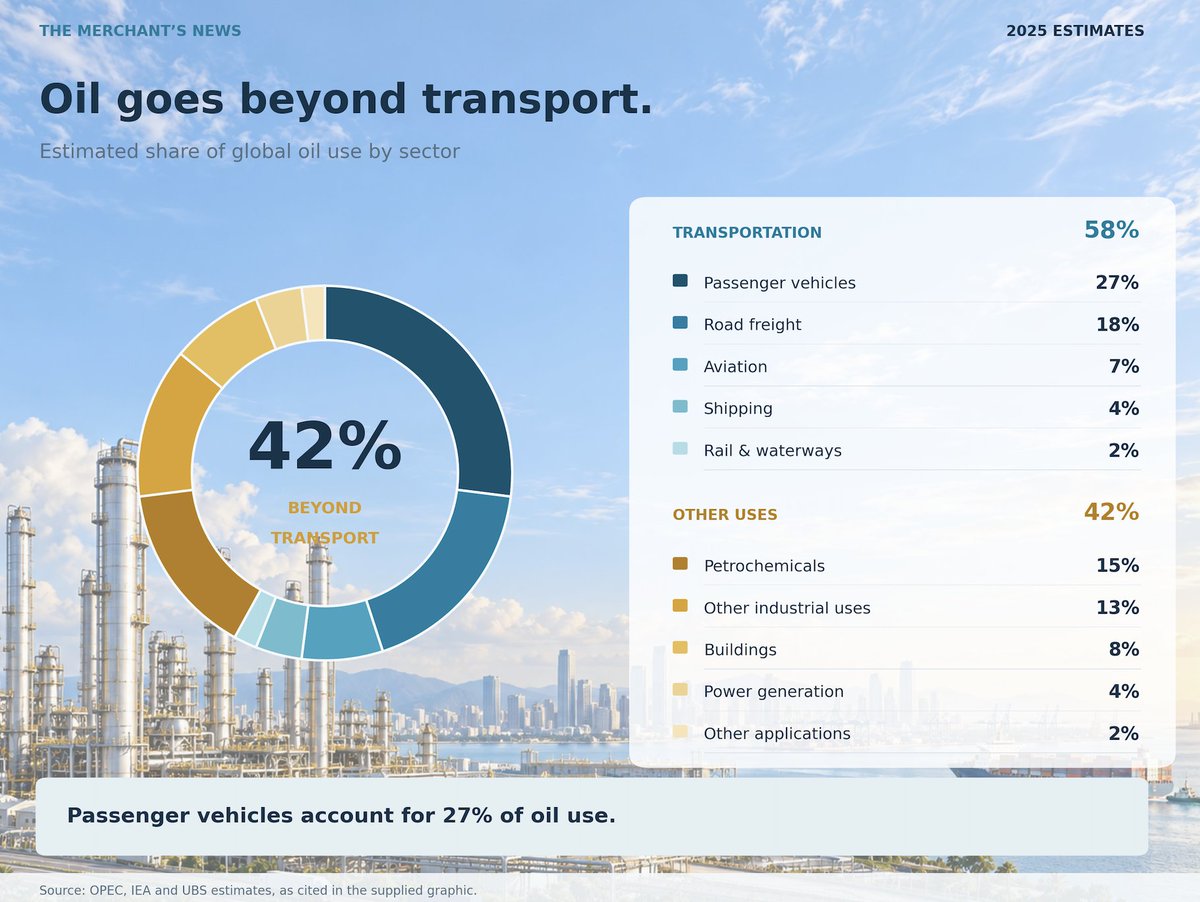
🚗⛽️ Cars burn only about 1/4 of the world's oil.
Passenger vehicles take 27%.
Road freight 18%, aviation 7%, shipping 4%, rail and waterways 2%.
Transport overall is 58%.
The other 42% never touches a road.
Petrochemicals 15%.
Other industry 13%.
Buildings 8%.
Power 4%.
That's the limit of the EV story....for now
Switch every car on earth to electric and about 73% of oil use is still there.
Trucks, ships and trains run mostly on diesel-type fuels, the product squeezed hardest right now.
Plastics and chemicals keep growing whatever happens to cars.
https://t.co/FUicYhfF8q
Source: OPEC, IEA, UBS estimates
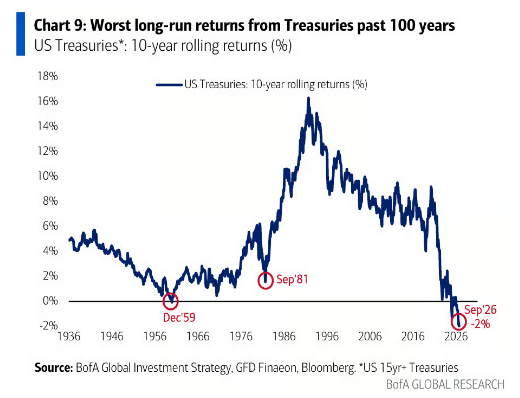
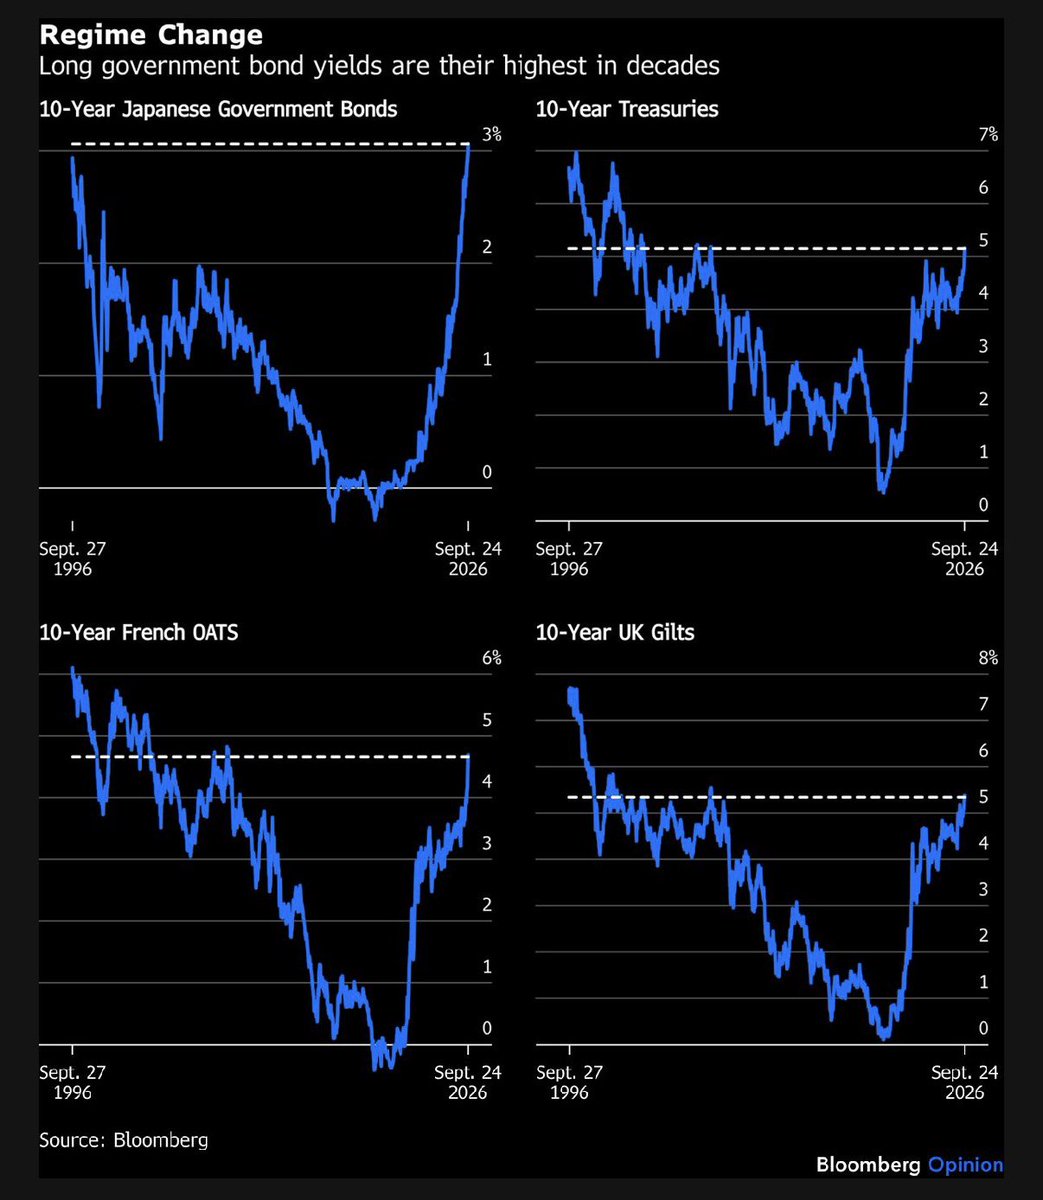
This chart from John Authers always-insightful note reminds us that the (mainly but not exclusively) US-led yield surge is now a generalized phenomenon, especially when it comes to reaching multi-decade levels.
#economy#bonds#markets#yields@johnauthers
With yields edging higher again this morning, the entire US Treasury yield curve from 5- to 30-year maturities is now trading above 5%.
(Image from the @FT below.)
#economy#markets#bonds#yields
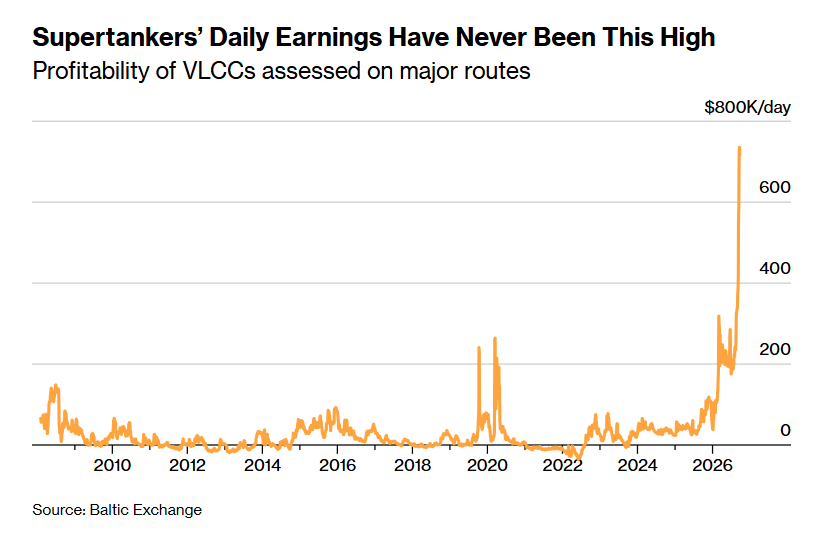
Supertanker Rally Lures Investors as War Squeezes Vessel Supply
A supercharged rally in tanker earnings is attracting new investors to the global shipping industry, as the war in Iran points to how geopolitical crises can drastically curtail the supply of vessels.
Very large crude carriers, the workhorses of the tanker fleet, have seen average daily earnings spike nearly twenty-fold this year. The upheaval caused by the Middle East has spread to smaller tankers and other vessel types, offering owners the chance to command higher freight rates and values for their ships.
Financial investors are piling into the sector. An exchange-traded fund tracking freight futures, the Breakwave Tanker Shipping ETF, has climbed an eye-popping 3,700% this year. (Bloomberg)