🎤 Mohammed Qahtani, a Saudi engineer, delivered one of the most impactful speeches ever, winning the Toastmasters World Championship. He showcased the strength found in words...
This man who heals what doctors can't:
Jiddu Krishnamurti.
It's impossible to be psychologically trapped, stressed, or anxious after understanding his teachings.
Here's his 5-step approach to unlocking mental freedom: 🧵
For centuries, naturopaths used nature's medicine.
Then Big Pharma buried it.
But they missed Barbara O’Neill—a 71-year-old naturopath proving nature still heals what modern doctors can’t.
Here are her 9 foundational pillars for optimal health and longevity: 🧵
@DrJustinbass@joerogan Read “The Beginning of Infinity” and “The Fabric of Reality” first. If you do it right, it should take a year or two. Then we can talk about the rest of the list.
[RISK MANAGEMENT]
1% OF ALL TRADERS REMAIN PROFITABLE AFTER 5 YEARS
Why?
Because 99% are too lazy to read and understand the following.
I know, I'm a mofo challenging your brain.. 🧵
I've simplified classical chart patterns to the most basic/common 8 patterns. I think most new patterns are derived from those basic ones.
Our brains pattern recognition is not that advanced to focus on so many derivatives. In fact better success can be achieved by narrowing down the below to select few.
There are plenty of traders who make a lot of money with 'basic' tools (price, Moving Averages, standard momentum indicators et cetera).
More complexity often = more noise, which makes it harder to build a system that you can actually execute in the market.
Unnecessary complexity also introduces a tracking problem. It's a lot easier to reconcile 1-2 conflicting signals than 4-5 signals all saying different things.
In most cases we're trying to map broadly similar market effects (trend, momentum, mean reversion, delta imbalance, and so on) - there are no prizes for getting the same answer with fancier working.
Start with simple stuff that you know well, and iterate slowly (if needed).
Complexity and new variables should be added as/if necessary and using the minimum effective dose.
The Moving Average trader with simple(r) entry/exit criteria will have an easier time refining their system than the trader who is looking at OI, funding, quarterly futures basis, CVD, liquidity heatmaps etc. simultaneously while trying to synthesise a single, coherent trade idea.
Learn to Trade the range with Volume of Profile.
Introduction.
As promised, releasing a simple to understand Range Trading Tutorial.
This is a good revision for experienced traders to revisit + new traders to bookmark
Practice this and observe 100 charts.
📚 USE THIS TOOL TO KNOW WHEN THE BULL MARKET IS LOSING STEAM
This tool helped me get out of the market before the crash in the previous cycle. Let's dive in! 👇🏽
Want an advice that will 10x your crypto experience?
Learn to sell.
No, I'm not referring to finding that secret technique that only 1% of the “gurus” know.
Our mind isn't accustomed to extracting profits, and when green candles manifest we remain impassive.
We don't know how to act because our brain perceives the situation as “not normal” forcing us to wait, hodl and ride the trend all the way down.
The solution?
Train your mind to accept selling as normal as buying.
Once per week, trim even just 1% of your position.
Over time, this will instill a healthy habit in your mind and when a parabolic price action takes place, you'll be ready to move.
That “armless feeling” won't be part of you anymore.
Each good habit and achievement in life comes with small actions taken every day.
Selling is no different.
📚USE THIS SIMPLE TRICK TO KNOW WHEN THE BULL MARKET TOP IS IN
This approach helped me sell my coins before Bitcoin crashed from 58k to 28k in a matter of weeks.
Let's dive in!👇🏼
During my analyses, you often see me writing about “BOS” and "CHoCH”.
“Bro, what the f** are those abbreviations?”
Don't worry, nothing too complicated. (keep reading to learn how to flex these fancy words in the face of your friends)
First of all, these 2 names are part of the Smart Money concepts world, which is simply the “modern adaptation” of the institutional trading concepts.
Basically speaking, BOS is the acronym of “Break Of Structure” while CHoCH is the acronym of “Change Of Character”.
A BOS is when a high or a low is being violated leading to a change in the trend (LTF) while a CHoCH is a shift in the market’s trend indicating that the previous trend may be losing momentum and that a new trend is emerging.
Of course, a CHoCH is also always a BOS while a BOS is not always a CHoCH.
But let’s see a concrete example.
This is the 4HR Bitcoin chart:
You can see that inside an HTF uptrend (notice the trendline), shorter trends can develop like in the case contained inside the black ellipse.
In that case, Bitcoin has created a LTF bearish trend where the first CHoCH has been identified with the red candle that has violated the previous low (look for the wick) and subsequentially a BOS has been created with the continuation of the trend breaking the recent low.
Conversely, we’ve seen a structural change with that bullish impulse (CHoCH) and the break of the previous LH, therefore shifting the trend from bearish to bullish.
At some point, Bitcoin has started to break down from the trendline which has represented the first sign of weakness (SOW) and then we had a final confirmation with that strong bearish impulse that has demolished the lows creating a significant CHoCH.
So, as you can see, these abbreviations are nothing too complicated and they simply represent LTF or HTF shifts in a market trend.
Now that you know what these words are you can start applying them to your favorite charts and make some screenshots to act as a “guru trader” on Instagram grabbing attention and hopefully some chicks.
#Bitcoin top signal: 1M Bollinger Bands
When the 1M Bollinger Bands stop expanding and curl up, we have our top
Even more effective with a candle close back inside the upper band
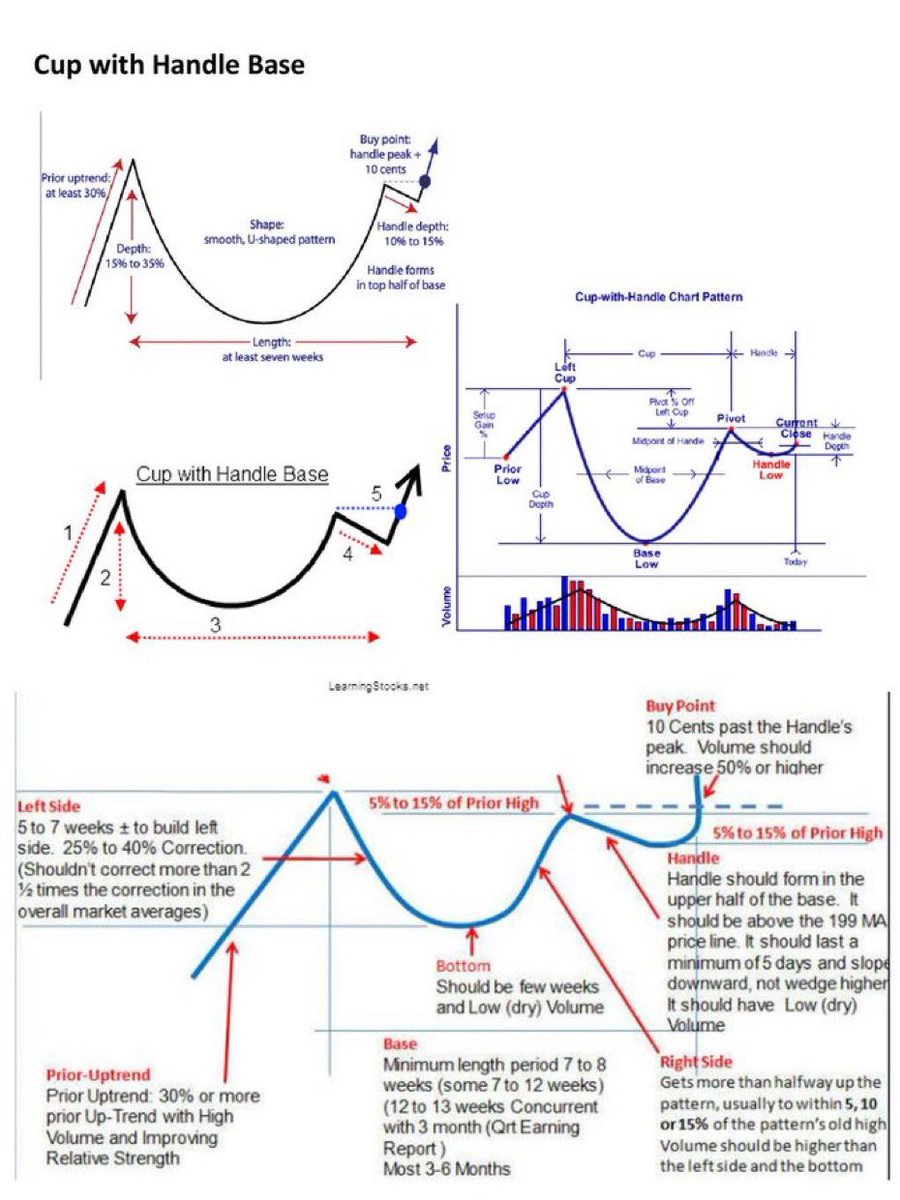
The cup ☕️ with handle base. One of the most important bases to study & identify 📖🧐.
Remember the depth of base should be 12-35% however it can be DEEPER in a bear market. Many leaders emerge from these patterns coming out of a bear market.
Every time you invest in a project, create a spreadsheet and note:
• Why you’re investing
• The top 3 points underpinning your thesis
• Your stop loss levels
• Your take profit levels + strategy
That way, you always have something to refer back to when things get emotional.