The upcoming weekly close on $BTC is relatively irrelevant for me.
Here is what I am actually focused on, on higher TF's:
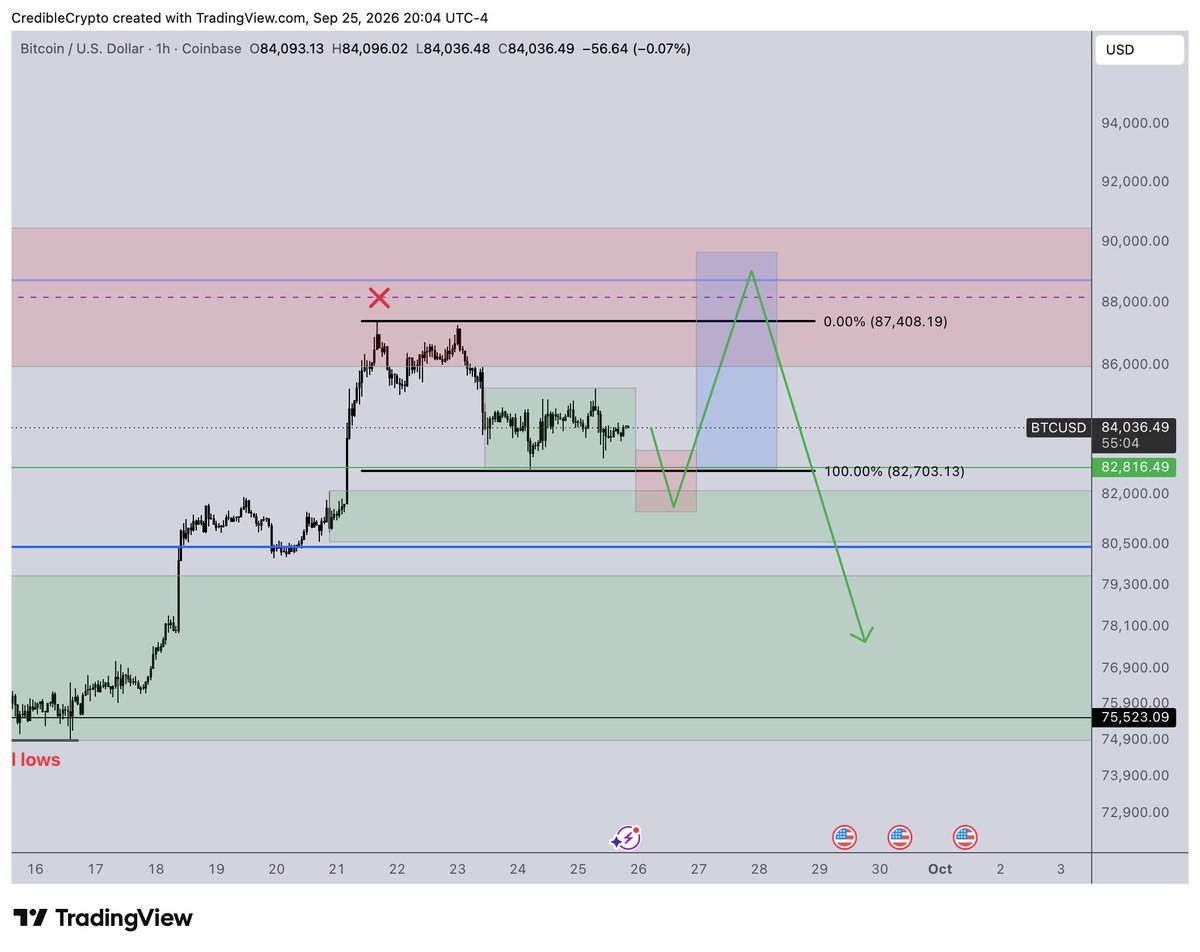
Again, on LTF I am looking for a move up to take all the untapped liquidity above us (as per my chart here: https://t.co/XbuBN9K62O) however even if this LTF move plays out it does not change the fact that we are still pushing up against a massive, HTF supply zone and without impulsive PA there is a high likelihood of rejection once again as we form what is essentially a HTF consolidation range (orange) before the next impulsive leg to the upside.
Meanwhile we have a massive liquidity void beneath us, and with the origin of our HTF impulse in the low 60k's, dipping into this liquidity void would not break significant HTF market structure and/or affect the HTF bull thesis in the slightest- it would again just be a deviation below our potential consolidation range in orange before the next impulsive leg up actually begins.
As always, we actively monitor LTF PA for potential changes to the expected path, but for now and based on everything I am seeing at this time, this is the most logical/likely HTF scenario imo.
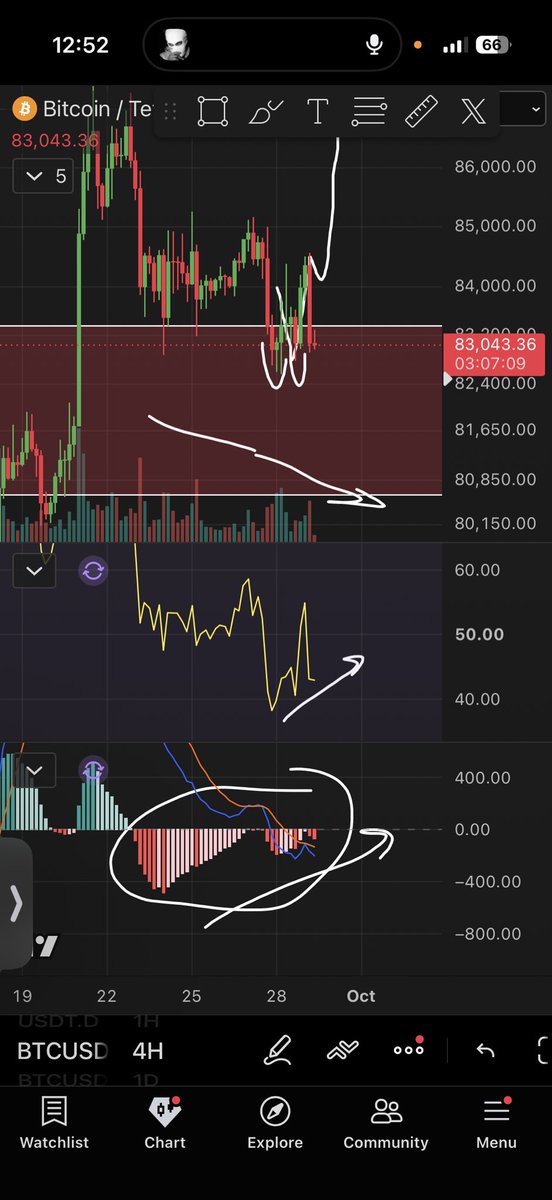
$BTC H4
Now forming bull divs RSI & MACD + bullish PA (volume down + price down).
All while retesting prior resistance as new support.
Seems like a nice pump is very possible here.
$BTC has now tested our key supply zone above, just like $ETH I suspect we are going to form a LTF range here before a deeper push into the 75-79k zone for now.
Can probably fade whichever side of this local range we take first but ideally we get a little PO3 setup to the local highs before a deeper pullback.
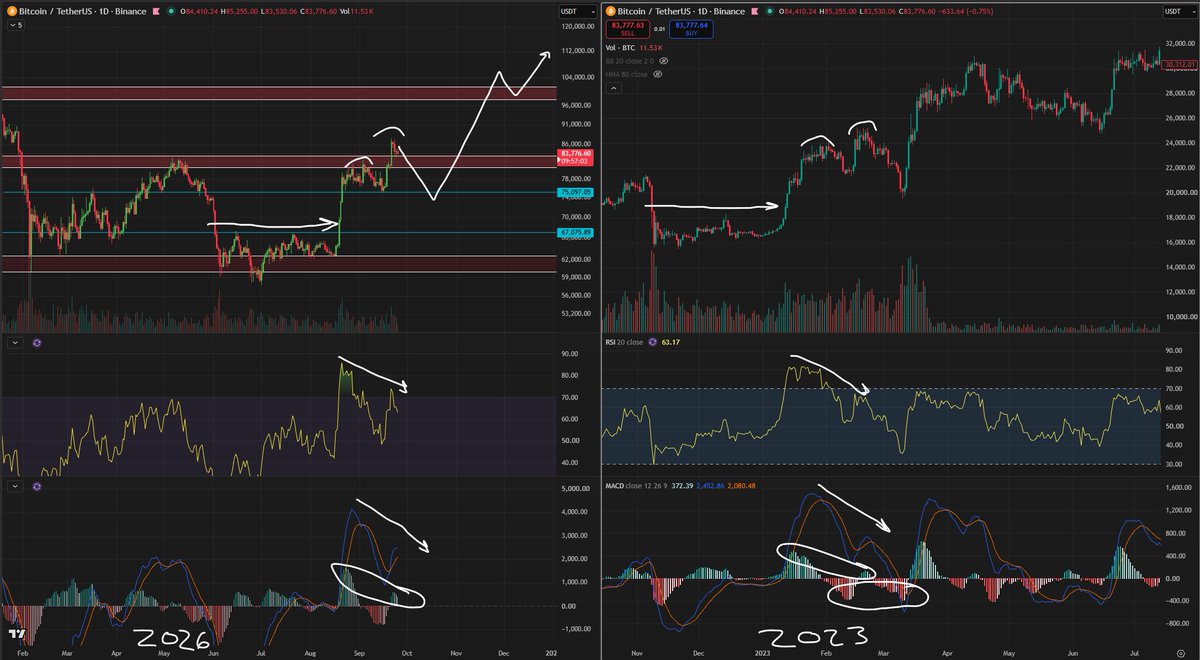
$BTC 1D
Looking very similar to our pump from the bottom in 2023. And although our 1W is still above resistance - you can't deny the similarities here.
A deep pullback would rage bait the macro bearish people, liquidate late bulls, & bring less confidence.
In a perfect world we would form a little distribution range here at the highs into our local supply zone before a deeper correction (potentially down to the equal lows). ethereum:native
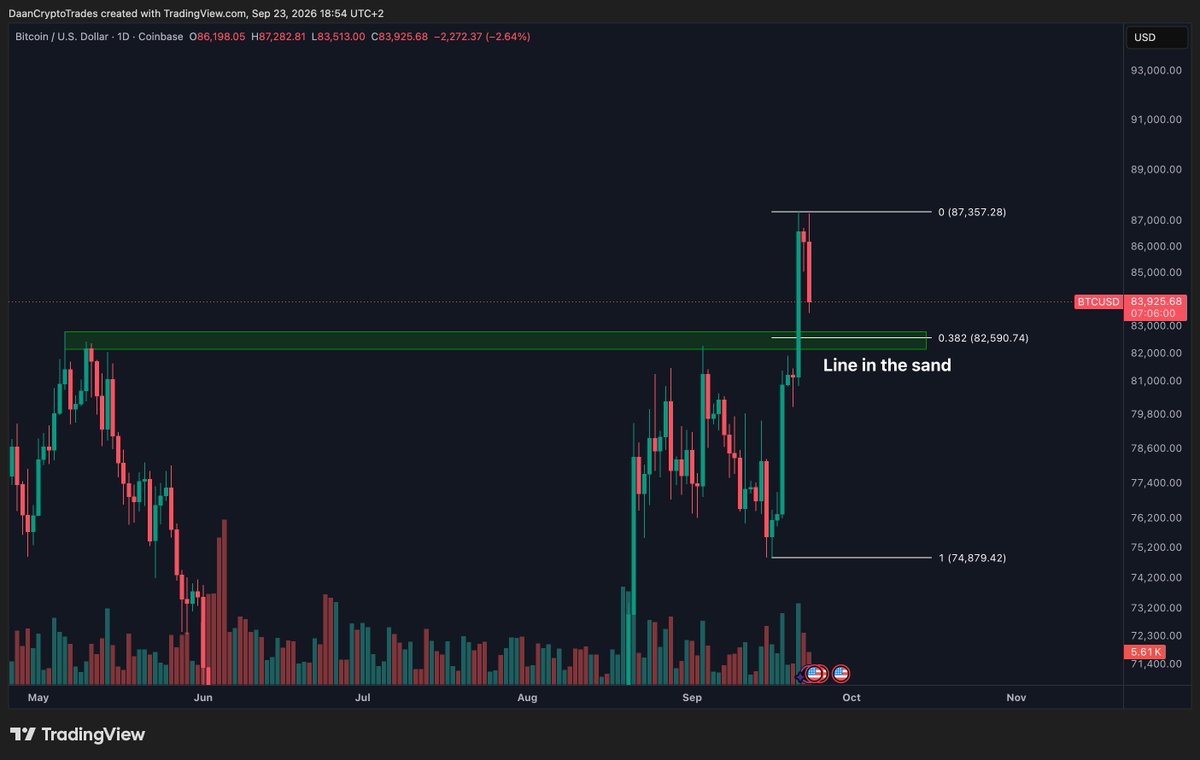
$BTC Green zone is the line in the sand for the bullish momentum.
Many that missed the breakout wanted a retest into the $83K-$84K region. The retest is here with a big leverage wipe.
If it still fails and trades below $83K anyways, then that is a sign of weakness and noteworthy. I'd personally see that as a reason to take the more cautious side into the end of the month.
As simple as that. Trend is up, but you need to maintain the breakout level.
If you're looking at beat down altcoin charts and wanting them to bounce you basically want to see them still above Augusta 19th price action and not revisit that level
That needs to hold as a lower range and the spring out needs to maintain
$TAO and $NEAR are good examples of this
$UNI June 15th candle/lower range is also a good example of this, UNI is just a bit further ahead than some of these other alts.
🚨 NEW: Anthropic has launched Claude for Financial Advisers, plugging its chatbot into investment and wealth-management software from BlackRock, Charles Schwab and Addepar.
#BTC
At this very moment, Bitcoin is positioned for a bearish Weekly Close below the 50-Week EMA (purple)
Of course, there are still a few more hours left until the Weekly Close occurs so things could still easily change
But if the Weekly Close occurs just like this and then the 50-week EMA is turned into new resistance afterwards...
There'd be a very similar situation to what happened when price initially retested the green 21-week EMA support but ultimately broke down from it weeks later (red circle)
Both of these EMAs tend to act as support in a Bull Market
So if they can't hold sustainably as support then that would be a confirmation of the trend not being in a full-blown Bull Cycle yet
$BTC #Bitcoin
You've got to know when to hold 'em
Know when to fold 'em
Know when to walk away
And know when to run
You never count your money
When you're sittin' at the table
There'll be time enough for countin'
When the dealin's done
#BTC
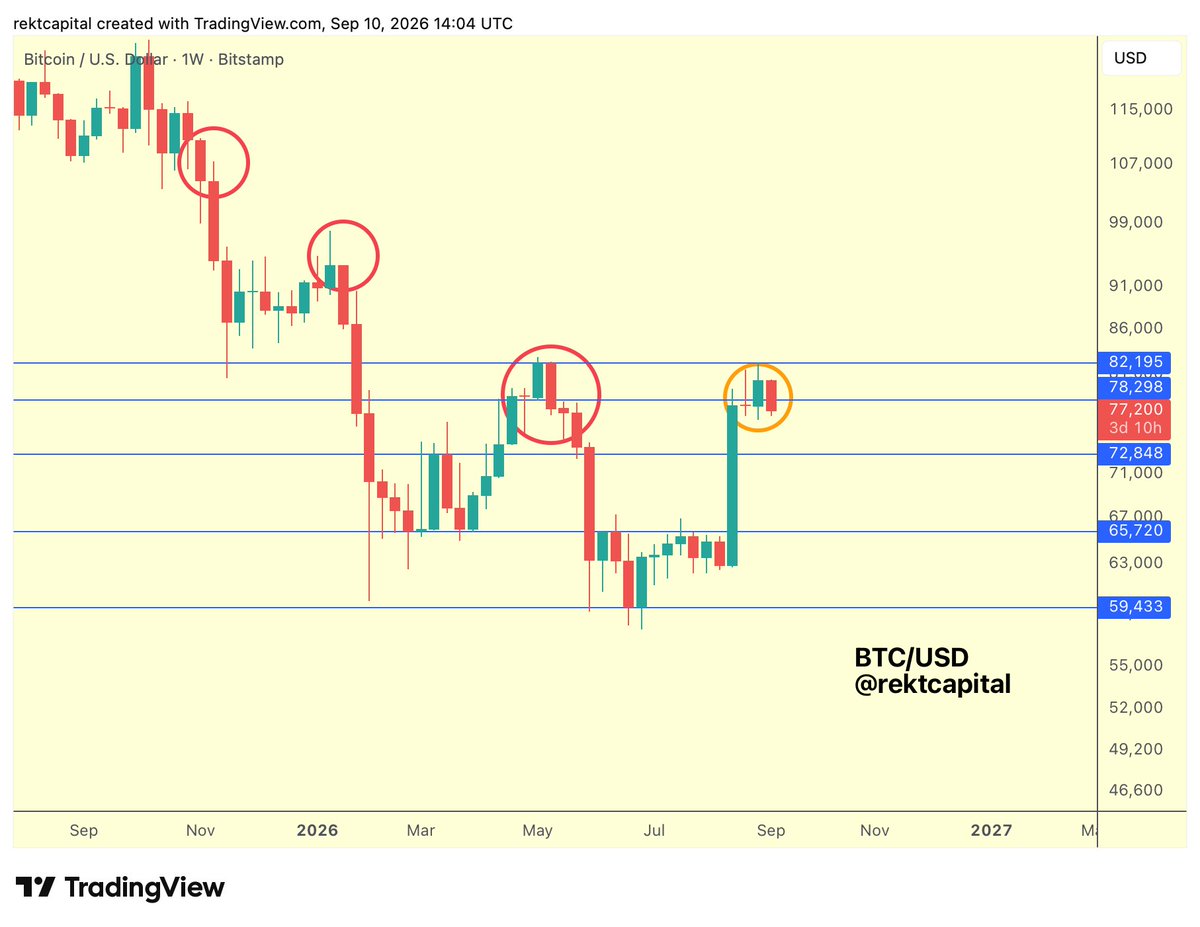
At this very moment, Bitcoin is positioned for a repeat of bearish price history
However, Bitcoin has a few more days to turn things around before the new Weekly Close, if it can
A Weekly Close below ~$78300 could set price up for a breakdown like in May
$BTC #Bitcoin