team lead / data journo / news dev @handelsblatt • alumnus @rbb24 @nzzvisuals @ft @compjcdf @zeitonline @IJ_Online
Follow+DM, if we should work together 🤝
Nachdem dieser Chart schon in alle denkbare Richtungen interpretiert wurde, haben wir uns einfach mal gefragt... Stimmt das so?
Antwort hier (Spoiler: es ist nicht einfach) https://t.co/c7jlBQsJJ6
#Schuldenbremse
Good thing that Germany is located on a different planet, where there are no investment needs like decarbonisation, education, defence or health care
(Chart from @Bloomberg)
I'm talking at a conference later this year (on UX+AI).
I just saw an ad for the conference with my photo and was like, wait, that doesn't look right.
Is my bra showing in my profile pic and I've never noticed...? That's weird.
I open my original photo.
No bra showing.
I put the two photos side by side and I'm like WTF...
Someone edited my photo to unbutton my blouse and reveal a made-up hint of a bra or something else underneath. 🤨
Immediately, I email the conference host.
(FYI he is a great, respectable guy with 5 kids at home.)
He is super apologetic and immediately looks into the issue.
He quickly reports back that the woman running their social media used a cropped square image from their website.
She needed it to be more vertical, so she used an AI expand image tool to make the photo taller.
AI invented the bottom part of the image (in which it believed that women's shirts should be unbuttoned further, with some tension around the buttons, and revealing a little hint of something underneath). 🤯
—
FYI the conference organizers were super apologetic and took down all of the content with that photo.
Vodafone, Telekom, o2: Wer bietet bei dir das beste #5G-Netz? Wir haben ein interaktives Tool dafür gebaut, um das herauszufinden. https://t.co/DP4fVNevld
@rainerfaus @wortmanncallejo @cornelius_mer@zweitstimme_org @lstoetze @simonsaysnothin@EliasKoch_ @HannahRajski Also wir haben hingeschrieben, dass das Modell *immer nur den Stand zum Datum* abbildet. Das haben wir nun auf zwei Plattformen und über mehrere Monate diskutiert. Aber gut, wenn Sie das für Ihr Ego brauchen, dass Ihr Bauchgefühl super ist, dann Glückwunsch an Ihren Bauch.
Hoppla,
die Wahrscheinlichkeit für ein #AfD Hattrick im Osten, dass sie also in #Thueringen, #Sachsen und #Brandenburg stärkste Kraft wird, hat sich deutlich verschoben. Grund dafür ist eine neue Umfrage von @freie_presse und Co.
https://t.co/q6iea4JONq
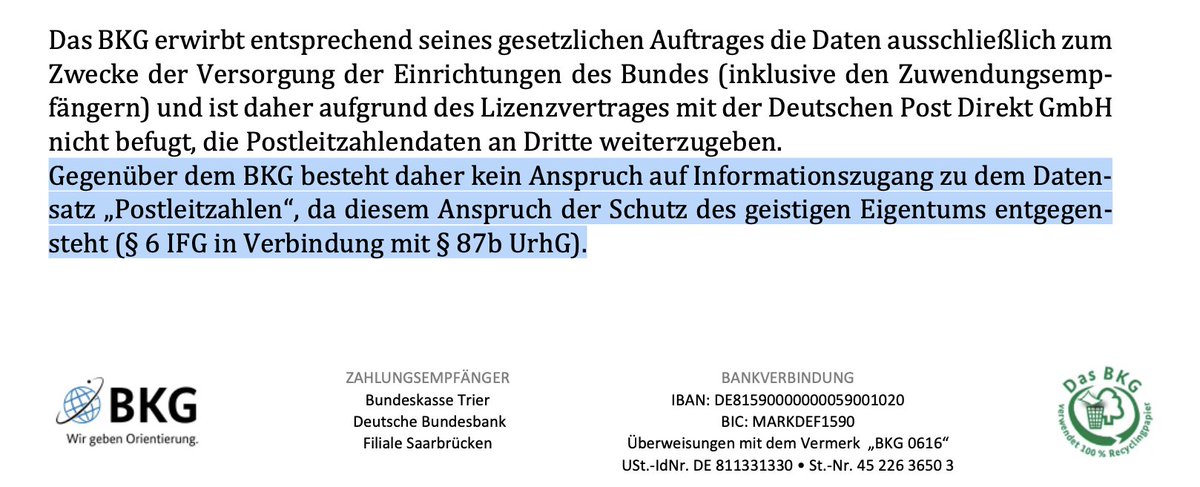
Liebe Grüße an dieser Stelle auch an das @BKG_Bund. Wie man mit Steuergeldern (die ich gerne zahle), so einen Quatsch abliefern kann, ist und bleibt ein Rätsel. Wieso dürfen Bundesbehörden PLZ-Daten nutzen für ihre Arbeit aber ich als Bürger muss mir die wohl nun erklagen.
Wir haben den Wahlrechner upgedatet rund um die Wahlen in #Thueringen#Sachsen und #Brandenburg.
CDU schafft es der AfD den Wahlsieg in Sachsen streitig zu machen.
In Brandenburg kann Kenia weitermachen.
Die Lage in Thüringen wird immer vertrackter...
https://t.co/DXhdWTqXUI
Wir haben unseren Wahlrechner für #Sachsen#Thueringen und #Brandenburg gestartet! Gemeinsam mit dem Newsteam vom @handelsblatt zeigen wir, wo die Umfragen stehen, welche Debatten es gibt und was all das für Wirtschaft und Politik bedeutet. https://t.co/8xgv6pnCtL
@glynmottershead As one of the trained ones: thank you!
There are quite regularly "Glyn & Martin moments" in my work routine where I am reminded of what I have learned from you two. These moments still inform how I work. And how I show trainees the ropes (a.k.a. we have "a lab" here now)
Wir haben Bewegungsprofile von Zehntausenden potenziell sicherheitsrelevanten Personen gefunden.
Ein massives Problem: Denn solche Daten werden im Internet gehandelt. Das Bild zeigt den Verfassungsschutz in Köln.
Hier haben wir knapp 2600 Datenpunkte von 80 Werbe-IDs gefunden.
Die Story in einem Satz: Die AfD gewinnt wohl gerade unter anderem die Landwirte in Deutschland für sich.
In einem Chart, der auch die statistische Signifikanz unterstreicht:
Alle reden darüber, wie stark die AfD im Osten ist. Dabei gewinnt sie längst ein neues Klientel für sich: "Wessis" aus den wohlhabenden, ländlichen Regionen.
https://t.co/TiWfxgAydS
A YEAR ago I wanted to learn #d3js and @neo4j. I was overwhelmed, thought it IMPOSSIBLE, but kept with it. With help from @DataVizSociety and @observablehq things started to click. I CREATED MY FIRST SCROLLYTELLING PIECE - let me know what you think!! https://t.co/s9hjYaVp7z
🎉 Great news for the #GIS and #Jupyter communities! The @ESA is funding a project by @QuantStack and @simula_research to bring collaborative editing to GIS workflows in JupyterLab. Let's explore new ways of working with geospatial data! 🚀 https://t.co/LGtjSVNHgo
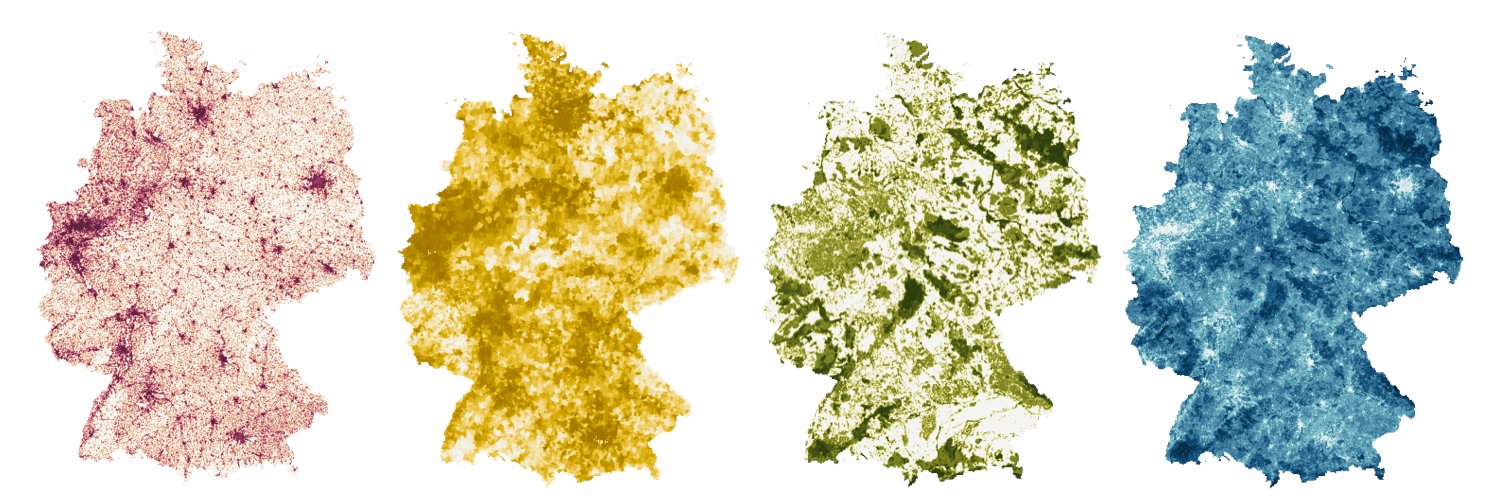
Deutschland hat gewählt. Wie lassen sich die Ergebnisse erklären & wo gewinnen welche Parteien dazu? Ich habe dafür Strukturdaten und Wahlergebnisse aller Europawahlen seit 1994 zusammengetragen und ein paar statistische Modelle gerechnet. Ein Thread. 🧵👇
Stell dir vor, dass jede:r Sechste denkt, dass du hier nicht hingehörst und jede:r Fünfte in deiner Altersgruppe. Stell dir vor, du schreibst am Wahlabend mit deiner deutschen Familie und es fallen Sätze wie:
"Auswandern ist für Dich noch (sic!) zu früh".
If you’re interested in a behind-the-scenes look at how we work with climate data at the @FT, check out our weekly newsletter “The Climate Graphic: Explained”
In it @sdbernard and I cover all things climate data, analysis and visualisation
Sign up here:
https://t.co/LnHgcHgq4L