If you are curious why the Fed is once again choosing to favor growth over price stability, Read Arthur Burns from 46 years ago…
The Fed has completely lost its bearings and is no longer in control. The emperor has no clothes.
Powell’s uncertainty in the presser & his clear resignation to what has become a rudderless political process is clear.
The 🌎 where the simple 2 dimensional lever of monetary policy could reasonably be expected to navigate between growth & price stability is gone.
Enter the 1970’s👇
Dostoevsky was 28 when they stood him in front of a firing squad. Blindfolded. Hands tied. He could hear the rifles being loaded.
At the last second a messenger on horseback arrived. The Tsar had commuted the sentence. The entire execution was staged. Psychological torture designed to break him.
It worked. He had a seizure on the spot.
They sent him to a labour camp in Siberia. 4 years. Freezing. Starving. Sleeping on wooden planks next to murderers. His epilepsy got worse. He had no paper. No pen. Nothing.
When he got out he was broke. His first wife died. His brother died. He inherited his brothers debts. He was so desperate for money he signed a contract with a publisher that would have given away the rights to everything hed ever write if he missed the deadline.
He wrote The Gambler in 26 days to make it. Dictated it to a 20 year old stenographer named Anna. Married her three months later.
Then the real work started. Crime and Punishment. The Idiot. Demons. The Brothers Karamazov. The greatest novels in the history of the Russian language. Maybe any language.
The man who stood blindfolded before the firing squad, who convulsed on the ground while soldiers watched, who slept next to killers in Siberia for 4 years, who was buried in debt and grief.
That man wrote: "every minute can be an eternity of happiness."
He earned the right to say it.
its never over. never give up fren.
Joining SRP for Part 3 of their webinar series next Wednesday, May 6 at 11am ET.
We'll dig into how structured products and derivatives activity drives mechanical buying and hedging flows, and what that means for volatility and price action in the S&P 500.
Register: https://t.co/OraCemuU8Y
1/ Controversial take: hard work is more important than smart work.
It's a myth that we only have a few hours of good creative work per day. Train yourself to grind long hours first. You will surprise yourself. The work naturally become higher quality, less distracted.
@jam_croissant@Wildcats805 Neurocrine locked it at $53 cash and stock is basically there already. Still think a bidding war could push it higher, or is the deal basically done at this level?
Few things worry me more than this simple thought: I urge everyone to ponder what happens when the market embarks on its next downturn, & r/WSB discovers the power of puts & the gamma squeeze that they can generate going w/ institutional flow, as opposed to against it... ⚠️ ⚠️ ⚠️
A sharp re-correlation event is likely ahead:
In a healthy market, stocks tend to move together, either expanding breadth on the upside or compressing together on the downside. When large numbers of stocks simultaneously register extreme strength and extreme weakness, the market is signaling internal contradiction. This is investors disagreeing sharply about direction. This type of fractured structure has historically preceded turbulence, because markets rarely sustain contradictory internals for long. Eventually the tension resolves into a more uniform trend, and that shift often arrives with elevated volatility.
Fosback’s High–Low Logic Index quantifies this contradiction by measuring the share of stocks making new 52wk highs and new 52wk lows at the same time. Elevated HLLI readings indicate that the internal structure of the market is inconsistent with a stable trend. Too many stocks are behaving as if conditions are exceptional, but in opposite directions. Spikes in the indicator have repeatedly aligned with subsequent periods of negative returns and rising volatility, reflecting the market’s need to reconcile these mixed signals.
Return dispersion captures the same fragility from a return-based perspective. When individual stocks experience exceptionally large moves while the index barely changes, it indicates correlations have broken down and the cross‑section of returns has become disorderly. Extreme dispersion shows that capital is being pulled in opposing directions, precisely the dynamic highlighted by a high HLLI. The index becomes a misleading anchor, appearing calm while hidden instability builds underneath. Historically, such periods have been transitional, giving way to broad, correlated moves once a dominant macro driver emerges.
The LPPL framework fits naturally into this environment, as it mathematically identifies bubble-type price dynamics marked by accelerating, oscillatory behavior that cannot persist. The model detects “bubble exhaustion,” where prices have risen in a self-reinforcing pattern that becomes unstable, and “crash exhaustion,” where downside spirals have similarly run too far. Current LPPL readings show a market split between sectors exhibiting bubble-like upside exhaustion and others showing crash-like downside exhaustion. This mix reflects nonlinear dynamics characteristic of late-cycle instability and suggests that several sectors sit at mathematically unsustainable endpoints.
What ties LPPL signals to HLLI and dispersion is that all three frameworks diagnose instability rather than predict direction. LPPL captures instability in price patterns, HLLI in breadth, and dispersion in cross‑sectional returns. When all three light up simultaneously, they collectively describe a market stretched across conflicting pressures. This is the hallmark of late-cycle fragmentation, when internal relationships break down and sector behavior becomes desynchronized.
Taken together, the data materially increases the likelihood that correlations will snap back toward 1. A fractured state cannot sustain itself, and once the market resolves these contradictions, stocks tend to move together sharply. LPPL indicates that several sectors have reached unstable extremes, HLLI shows abnormal simultaneous highs and lows, and dispersion confirms extreme disagreement across stocks. Together, they portray a market approaching a phase transition.
Historically, when these conditions align, the resulting correlation spike is often asymmetric to the downside, as bubble exhaustion in defensives and cyclicals collides with crash exhaustion in growth and rate‑sensitive sectors. But regardless of the direction, the key takeaway is that diversification tends to evaporate at precisely the moment investors rely on it most. Correlations rise abruptly, idiosyncratic dispersion collapses, and the market resolves its internal conflict through a broad, unified move.
ht:
@TheMarketStats (High-Low Logic Index)
@VrntPerception (LPPL Chart)
Nomura (Dispersion)
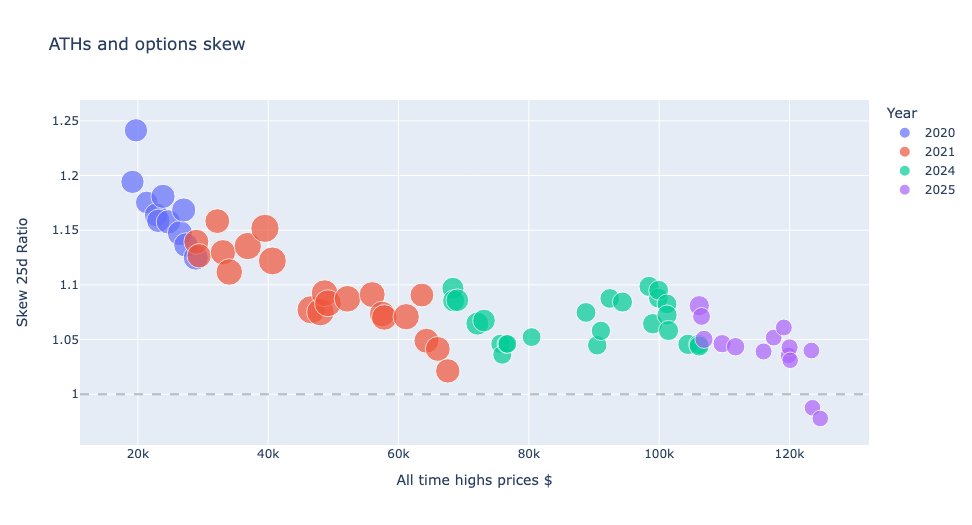
On October 6th, 2025 ATH was the most bearish ATH in Bitcoin history.
Spot price was pushing new boundaries, but the options market was signaling an exhaustion for upside demand.
A breakdown of the structural divergence and why I think we are in "TradFization" regime: 🧵👇
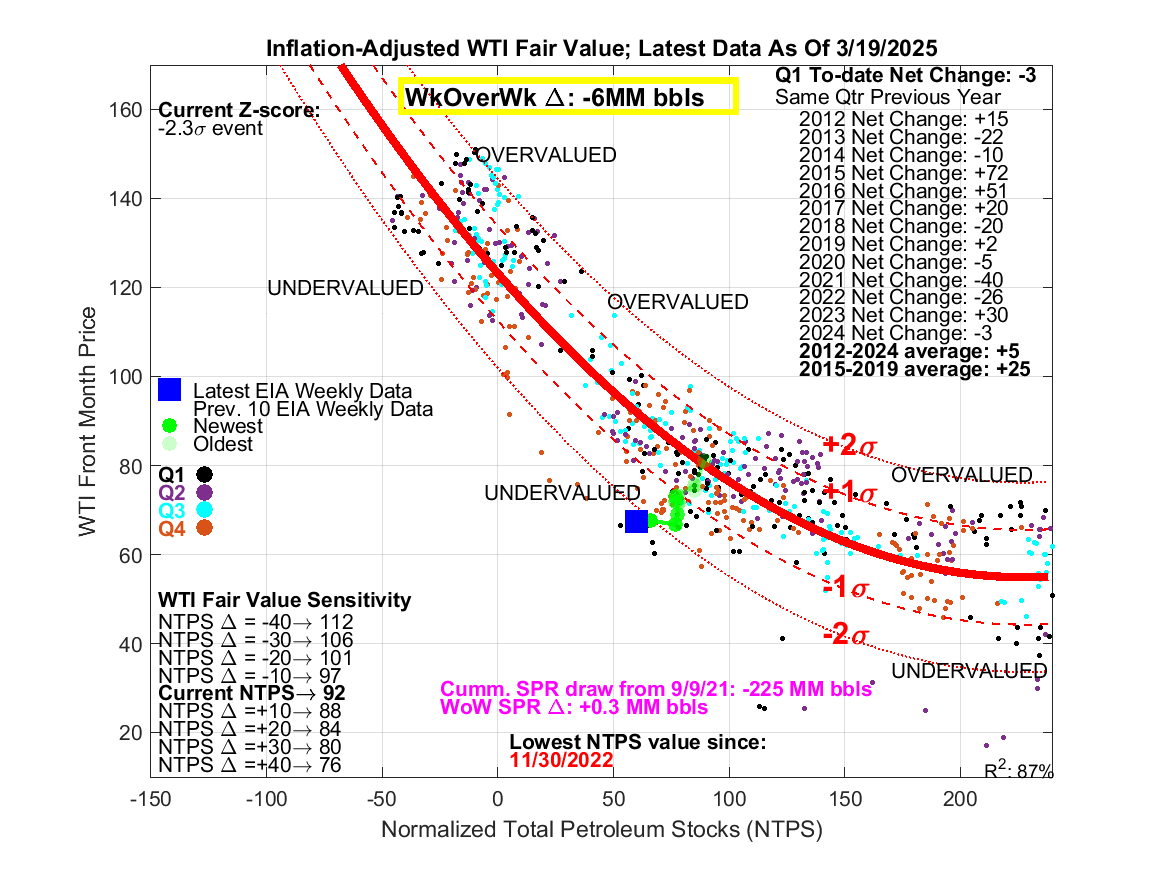
Total commercial inventory ex. other oils was down 6M bbls WoW. Implied WTI fair value price of 92, or $25 undervalued from current market price. commercial inv ex. other oils is at a 2.5 year low and the lowest print since Nov 2022. I remain long crude oil futures (CLK25).