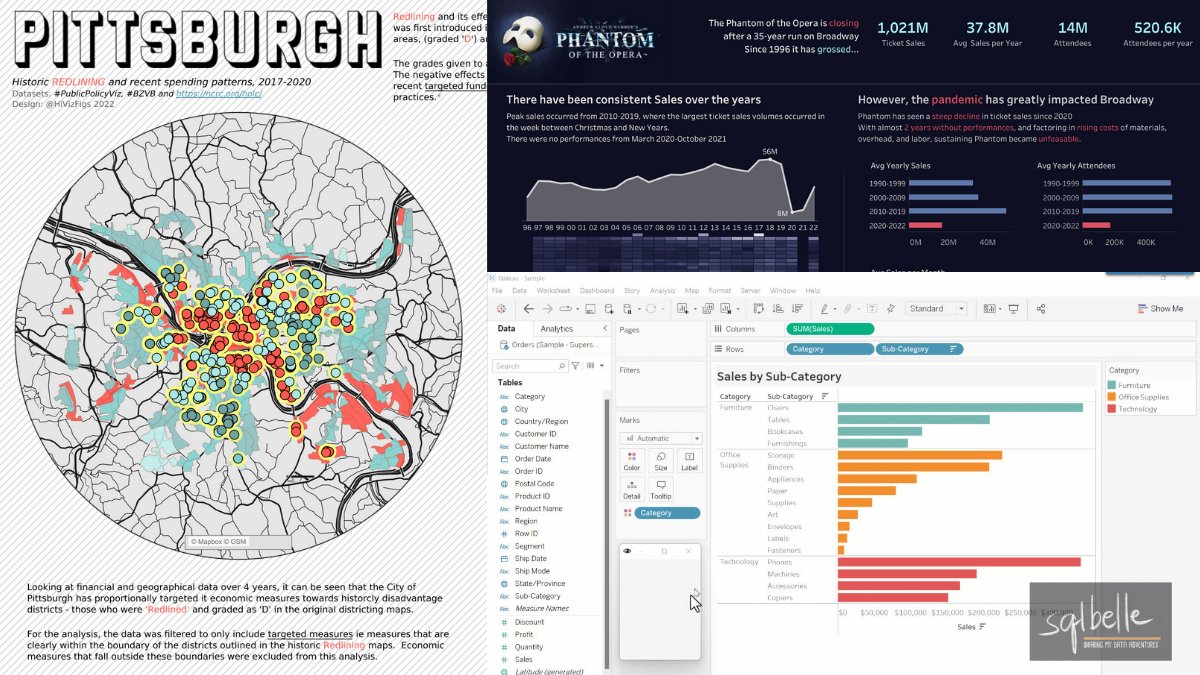
Thanks so much @tableaupublic for featuring my viz on #VOTD! I got really into this particular project by #B2VB and #PublicPolicyViz - a great data set and great challenge!
See how Back 2 Viz Basics (#B2VB) and #PublicPolicyViz come together in this #VizOfTheDay by @HiVizFigs to illustrate how redlining and recent spending patterns have impacted Pittsburgh communities to this day. https://t.co/3GnZSuBiei
@ZenDollData@VizFSG@WHO Haha, thanks. I see what you mean about the value - l'll try to have a go when I've got some free time. They are there more as placeholders until I can figure out whats going on with data in those other two categories (income & age). Thanks for the feedback
@epitroppy @tableaupublic I made the map on Mapbox then made an overlay (in this case an svg that had a transparent hole positioned over the map) to create a circle border effect essentially blocking out the rest of the map underneath
Thanks so much @tableaupublic for featuring my viz on #VOTD! I got really into this particular project by #B2VB and #PublicPolicyViz - a great data set and great challenge!
See how Back 2 Viz Basics (#B2VB) and #PublicPolicyViz come together in this #VizOfTheDay by @HiVizFigs to illustrate how redlining and recent spending patterns have impacted Pittsburgh communities to this day. https://t.co/3GnZSuBiei
Here’s my viz for #MakeOverMonday Week 35 - Military Spending
Link: https://t.co/EGomcUHaaG
Tools: Tableau, Excel, Illustrator
#Data22#TableuPublic#dataviz
https://t.co/YKIu6EXc8N