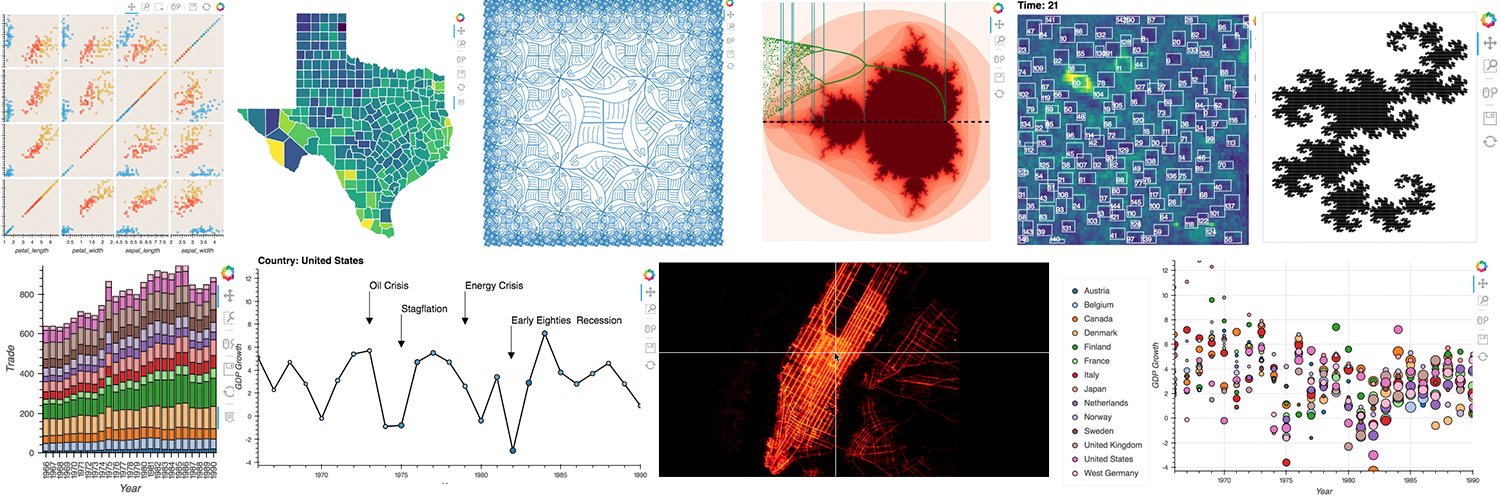
We are pleased to announce the release of HoloViews 1.13.3! The 1.13 series added many exciting new features such as linked brushing, @rapidsai cuDF support, annotators, new elements, improved @plotlygraphs and @datashader integration & more. Check it out: https://t.co/53OolzjBF6
⚡️ HoloViews 1.20 out now with major speed boost for large datasets! Plus...
📊 ImageStack: Visualize 3D datasets
🔍 Interactive pop-ups for data exploration
🧠 Subcoordinate-y, great for EEG analysis
📏 Precise measurement with scalebars
Blog ⬇️ https://t.co/27eKSxHM0X
1/🧵
📏 Scalebars:
- Automatic scale measurements
- From microscopic (µm) to astronomical (Em)
- Perfect for scientific visualization
- Context at any scale
5/🧵
Thank you to everyone who participated in the HoloViz user survey! For an overview of the results and what we are doing to address your concerns read this great writeup by Demetris Roumis: https://t.co/KU0GeqzLpK
You can make some really nice-looking interactive plots with @Panel_org and @HoloViews hv.scatter. Collapsable accordions (in the left-hand side panel here) are also really handy when you have a lot of options/widgets and you'd like to prevent your app from looking too busy.
Ever wondered how chord diagrams are created? Or what is a chord diagram in the first place? This article using @HoloViews makes it easy to understand!
https://t.co/67gqvyoO6q
#chorddiagram#holoviews#python#dataanalytics
This was done using @Panel_org geoviews @HoloViews@bokeh and @datashader
All amazing python libraries that you should check out if you’re into interactive visualizations!
My #fusionenergy#opensource software dream:
Magnetic-confinement fusion research should create their own interconnected ecosystem of open-source #python packages for analysis, following the model of @pangeo_data
@mrtn_rck Hard to debug without the data, but what that error message is saying is that the provided dataframe doesn't have a column with that name. Are you sure it's the right spelling? If there's definitely such a column in the df, then it may be an issue to report.
Video visualizing 1,000,000,000 points
https://t.co/m3f98C9dbM
This is a common example with Datashader. This video is different in that it focuses on performance tuning. When we start, an update takes 40s. When we're done, it takes ~1s.
High performance requires thought.
.@AnacondaInc is partnering w/ @bokeh & @NumFOCUS to support new open, OS-agnostic #dataviz tools for bioscience applications. 📊🏥
W/ support from @ChanZuckerberg, our goal is to accelerate scientific discovery.
Learn more here 👇
https://t.co/JpjSeDpaXe