#Datashader is an #OpenSource library for rasterizing large amounts of data into beautiful, accurate images. Datashader is a project of @AnacondaInc. #DataViz
We’re excited to announce our support for Pandata, the scalable open-source analysis stack 🎉 🐍 🌐
Pandata offers a set of general-purpose & powerful open-source data analytics tools enabling scalable data processing for any domain.
Read more here 👇
https://t.co/A7U0aHJRod
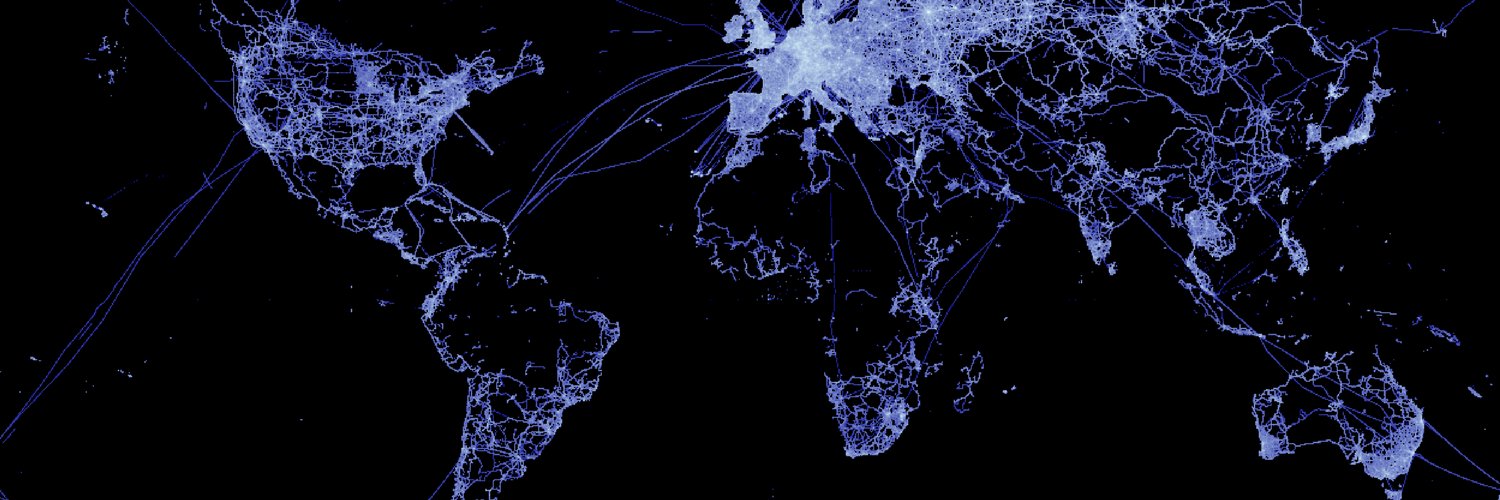
Code Dataset Visualization—11.66 million files from the Stack, a @BigCodeProject dataset sourced from permissively-licensed @github repositories spanning 86 programming languages (StarCoder languages subset).
🎉 We’re thrilled to announce @AnacondaInc’s first ever #DataAppContest !!
The competition goes from June 13-30, so start building your team for the chance to win great prizes & showcase your skills!
Learn more & register here 👇
https://t.co/5CYS5vTAbM
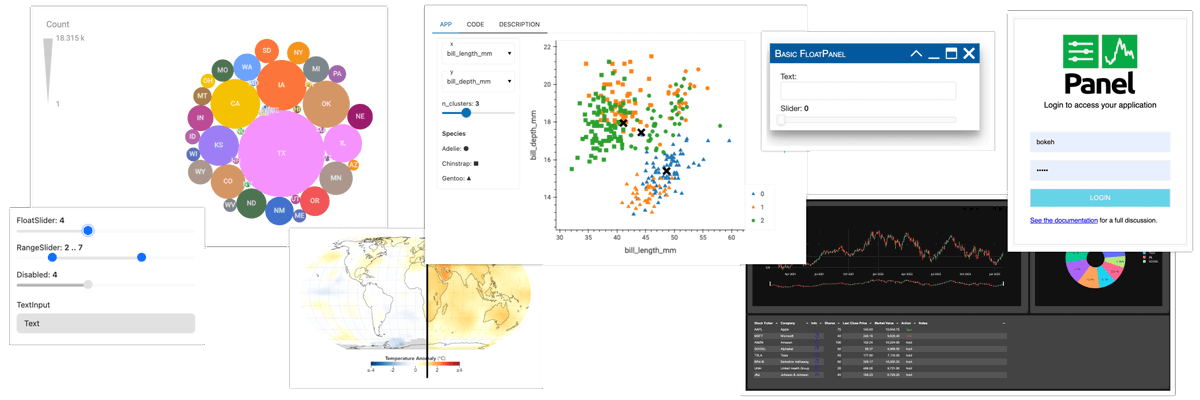
We are thrilled to announce the availability of the Panel 1.0 release candidate for general testing! This release represents a leap forward in performance and usability. We need your help to make this a smooth transition, find the announcement here: https://t.co/F281SP9GHy
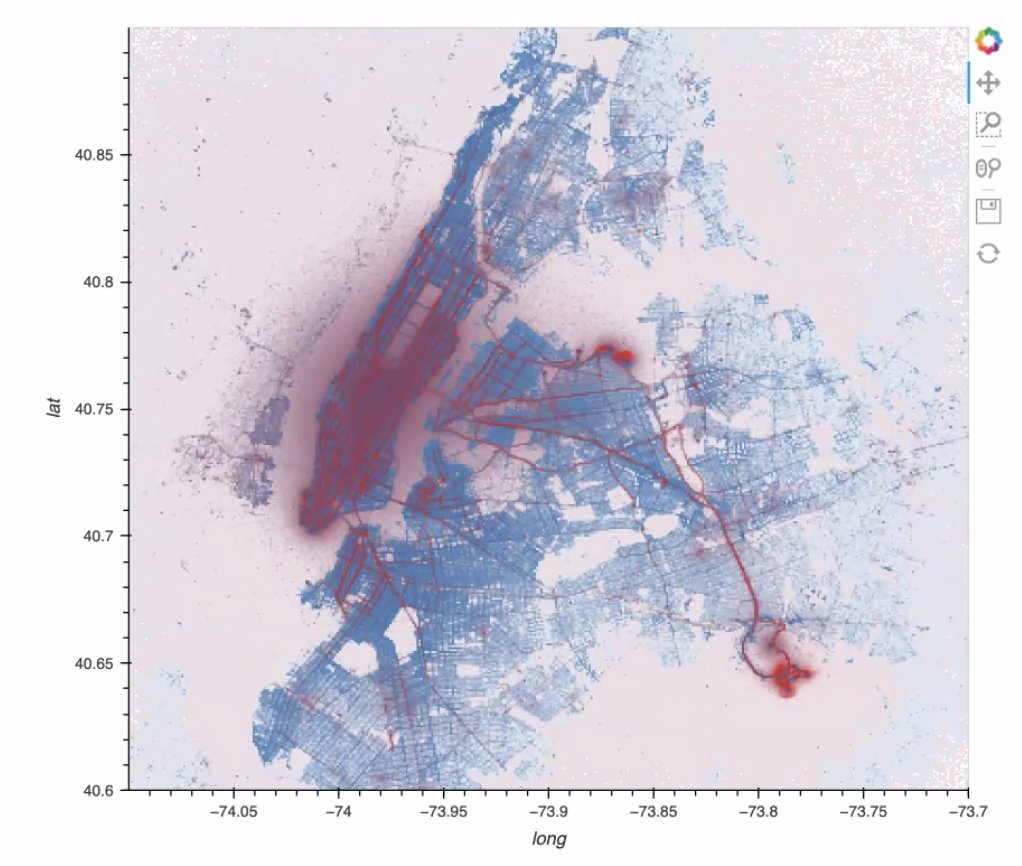
We revamped our Bitcoin OTC user ratings example to use Hiveplotlib's @datashader capabilities. We see changes in trust in the network over time that appear to correlate with the price of Bitcoin. For more, check out our docs: https://t.co/gP6FkaIdDx
Check out this new review of Python viz libraries for geographic applications, comparing Altair, @Bokeh, Cartopy, @Datashader, GeoPandas, Geoplot, GeoViews, hvPlot, and Plotly: https://t.co/dF6ZRzlWl6
Video visualizing 1,000,000,000 points
https://t.co/m3f98C9dbM
This is a common example with Datashader. This video is different in that it focuses on performance tuning. When we start, an update takes 40s. When we're done, it takes ~1s.
High performance requires thought.
We are excited for @HoloViews, hvPlot, and @Panel_org to start building on the upcoming better support for bioscience and biomedical applications in @bokeh !
@PratapVardhan@sujeetomar@streamlit Datashader easily handles 10 million or 500 million, and takes all data points into account when constructing the visualization (accumulating them per pixel and faithfully reporting the density per pixel). It's a good choice for anything over tens of thousands of points.
@HoloViews@sophiamyang Exciting hvPlot 0.8 news: In addition to @bokeh, you can now create @matplotlib and @plotlygraphs: https://t.co/QOW5Y9tomJ Compared to the default Matplotlib Pandas .plot(), hvPlot adds automatic widgets for exploring data, easy layouts, maps, datashader, and more!
We are very excited to announce the release of hvPlot 0.8! Discover the new features here: https://t.co/tjOHHTkmin or check out @sophiamyang's amazing video: https://t.co/5Oh9pa5FTg
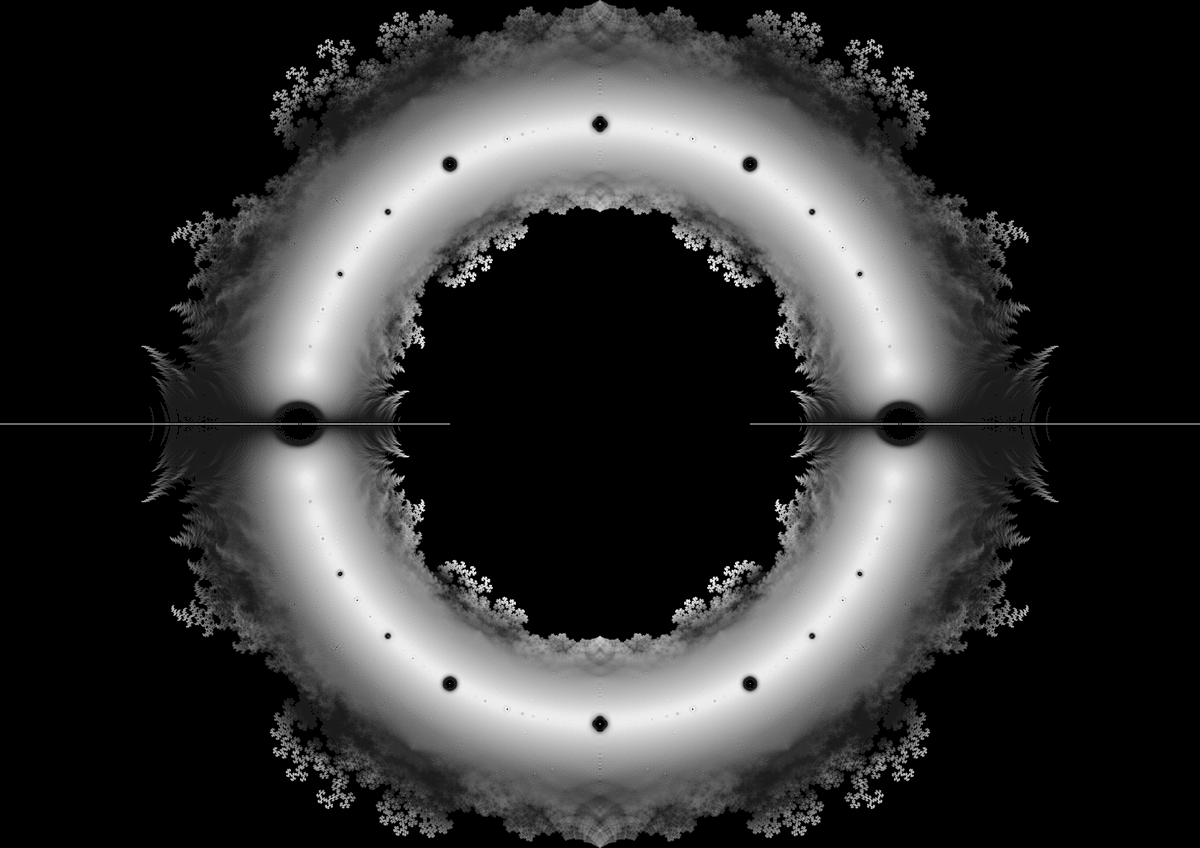
The beauty of matrix eigenvalues.
Eigen Values of 1M random matrices of form [A 1 -1; -1 B 0; 1 -1 -1]
Made in #Python using @datashader and @matplotlib
Inspired from the same viz by @BohemianMatrix
@mathieubastian@nicolasbchb@Neolectron@sigmajs@Gephi Datashader directly supports points, lines, areas, rasters, trimeshes (triangle-based meshes), quadmeshes (irregular rasters), and polygons, and other libraries use those primitives to support many other types of plots (see https://t.co/3bvyE2Q0ZH).
@nicolasbchb@Neolectron@sigmajs@Gephi Datashader dessine des millions de points en millisecondes (ou des milliards en secondes) sur un ordinateur portable. Et si vous l'utilisez à partir de https://t.co/r0MZO387ee, il redessinera lors du zoom et du pan, ce qui facilitera l'exploration de "big data".


![TheShubhanshu's tweet photo. The beauty of matrix eigenvalues.
Eigen Values of 1M random matrices of form [A 1 -1; -1 B 0; 1 -1 -1]
Made in #Python using @datashader and @matplotlib
Inspired from the same viz by @BohemianMatrix https://t.co/UvRkYDeUUO](https://pbs.twimg.com/media/Fc5foy5XgAAUbrp.png)


