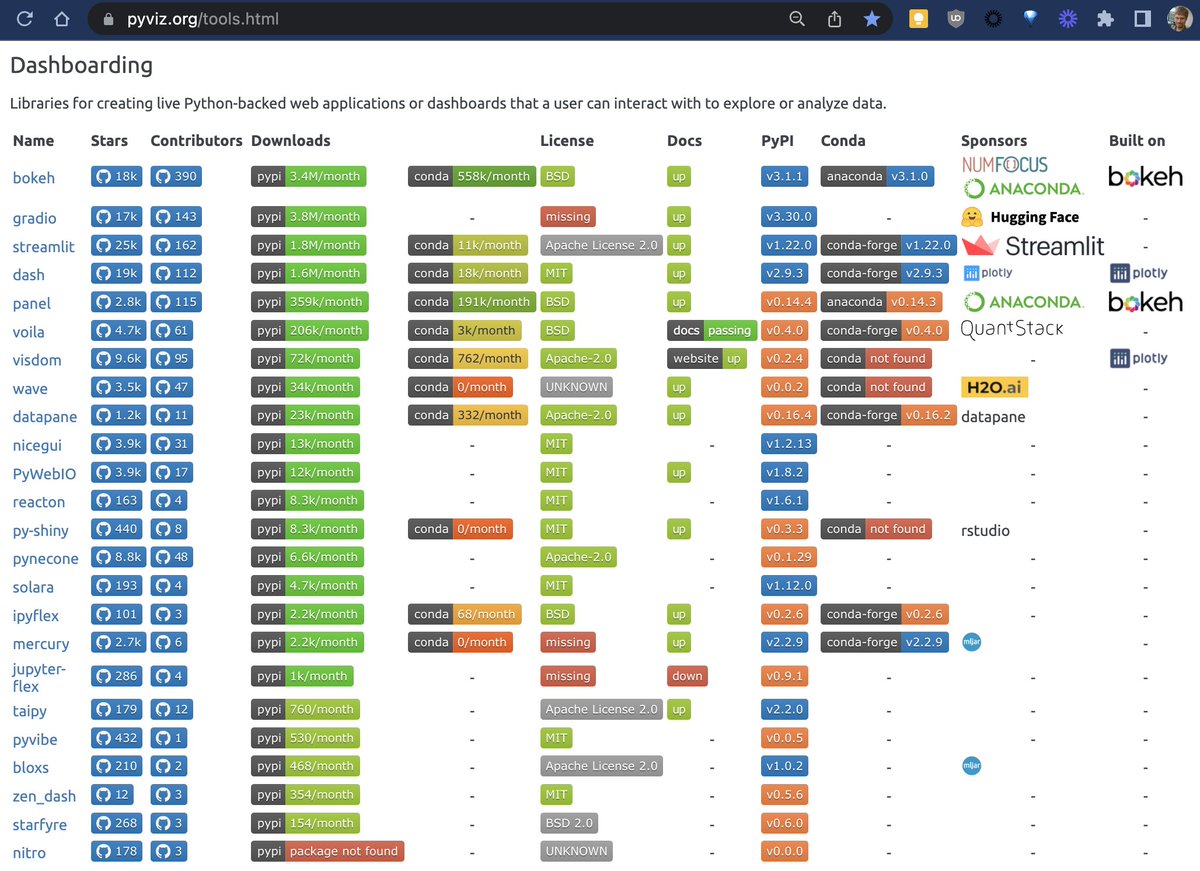
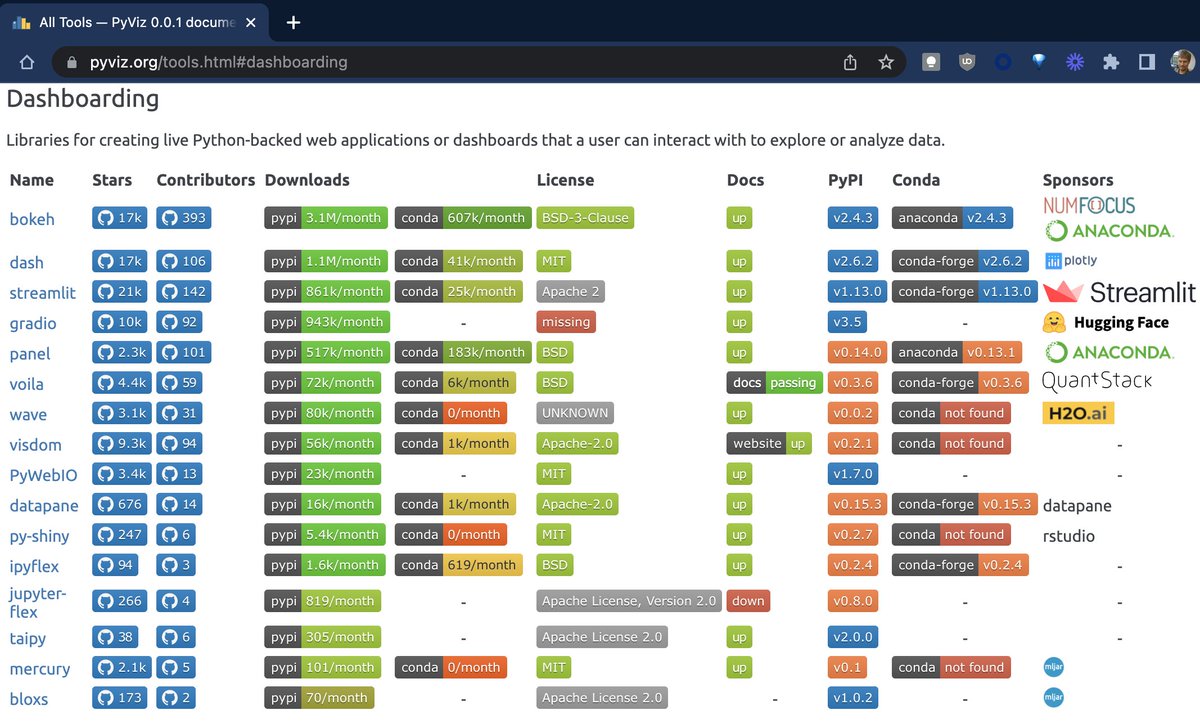
In our latest blog post, we explore the landscape of Python web frameworks. Whether you're interested in data dashboards, interactive applications, or exploring ML interfaces, we compare popular frameworks like Streamlit, Dash, Flask, and more. https://t.co/os02TgDAaS
New blog post about the revamped Xarray tutorial!
https://t.co/6EEg7etlnw
Many thanks to @NASA Open Source Tools, Frameworks, and Libraries program for funding this work!
See the tutorial material here: https://t.co/d9H5sp1VIx
hvPlot 0.10 has just been released! Check the release blog post that also goes over the main features released in version 0.9! #Python#dataviz#DataScience
https://t.co/36wy1C7Bsi
🎉 We’re thrilled to announce @AnacondaInc’s first ever #DataAppContest !!
The competition goes from June 13-30, so start building your team for the chance to win great prizes & showcase your skills!
Learn more & register here 👇
https://t.co/5CYS5vTAbM
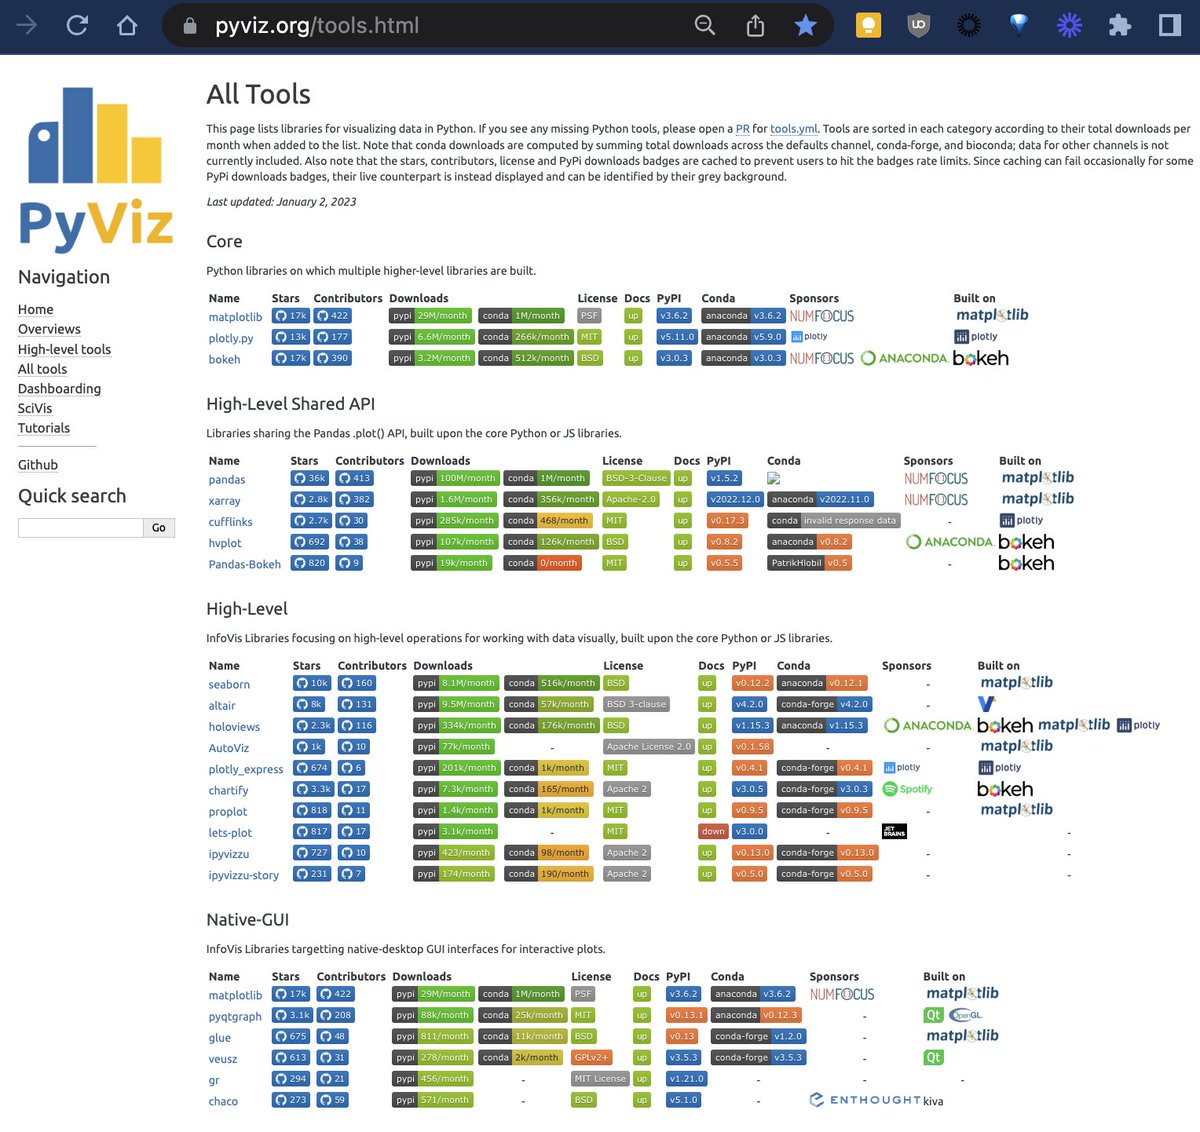
@PradyuPrasad See https://t.co/jwjK41x72E for lists and overviews of *all* Python OSS data visualization tools. Matplotlib is the most well established, but there are a lot of other good choices!
@mohdatif1987@matplotlib@HoloViz_org See https://t.co/jwjK41x72E for complete listings of Python OSS data-visualization tools, and open an issue or pull request if anything is missing!
Check out this new review of Python viz libraries for geographic applications, comparing Altair, @Bokeh, Cartopy, @Datashader, GeoPandas, Geoplot, GeoViews, hvPlot, and Plotly: https://t.co/dF6ZRzlWl6
@NilsNemitz@pyqtgraph@fcrameri See https://t.co/YKy6q9xbxf for a list of all the major colormapping libraries for Python, and please submit a PR if we've missed any!
@gib_hurst Streamlit is cool, but Python offers lots of other options too, each with major advantages. See https://t.co/xvkIubyM0p for the complete list.
Attention anyone interested in Python data visualization! https://t.co/fYvFmMovMd is trying to improve the user experience of our docs and websites. If you have ever tried out a https://t.co/fYvFmMovMd tool, please help by filling out our survey: https://t.co/6xcWI2Rdlq
@ErinFischell@XavierMouy@Panel_org See https://t.co/fCHxXH79ZF for the complete and current list of Python data visualization tools; there is lots of great stuff out there!