I think Tyran Stokes, Quintin Coleman, and Ivan Kharchenkov are my comfortable top 3 at the moment.
Two real floor-raising point forwards and a scalable guard who fits with anybody
Quintin Coleman is looking like my Number 2 prospect. His feel for the game is already so high. Natural connector that can fit in any lineup, but he has the skillset to scale up in usage if necessary.
Early Regularized Adjusted Plus Minus Scatterplot among the Top 50 Prospects from the @tankathon Big Board
Ivan Kharchenkov & Tyler Tanner are the only prospects in the upper quartile of both ORAPM & DRAPM. Tyran Stokes comfortably leads in DRAPM.
Data from Hoop-Explorer
@Barlowe500 They weren’t too bad. They just need more reps together.
46% from the field & 37% from 3 against probably the best defense in the country.
The main issue was the A/TO ratio. That tells me it’s a chemistry issue, but UVA is a very tough test two games into the season.
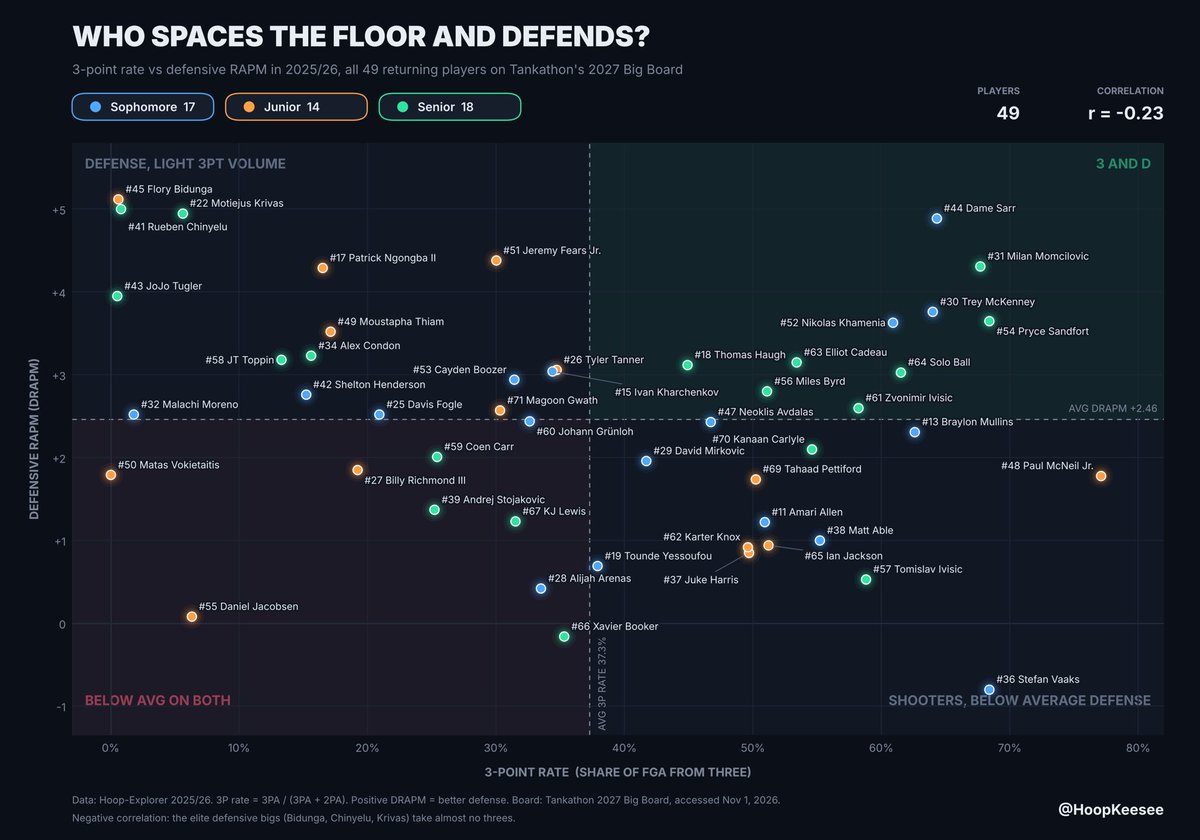
Dame Sarr is the best value draft prospect in the upcoming draft. Already has a defined role waiting for him
- 64% of his FGA came from 3 last season
- 8th nationally in Defensive RAPM (1st among freshmen).
I’m giving him a Top 10 grade. Will be able to defend Number 1 options and punish defenses for over-helping
I took all of the returners from Tankathon’s early Mock Draft, and plotted them against their 3PAr & Defensive RAPM from last season.
A good way to evaluate who would be comfortable fitting into a complementary role at the NBA level
Dame Sarr is the only prospect in the 90th percentile in both 3PAr and DRAPM.
Tyran Stokes is the best playmaking prospect in the draft at 6’8. That’s the ultimate separator that’ll make it difficult for other prospects to catch up.
Trevon Brazile is the perfect NBA big archetype: Pick & Pop threat who outruns other bigs in transition
- 94th percentile in max vertical leap
- 90th percentile in wingspan
- 86th percentile in transition frequency
- 71st percentile in Pick & Pop frequency
High value pick
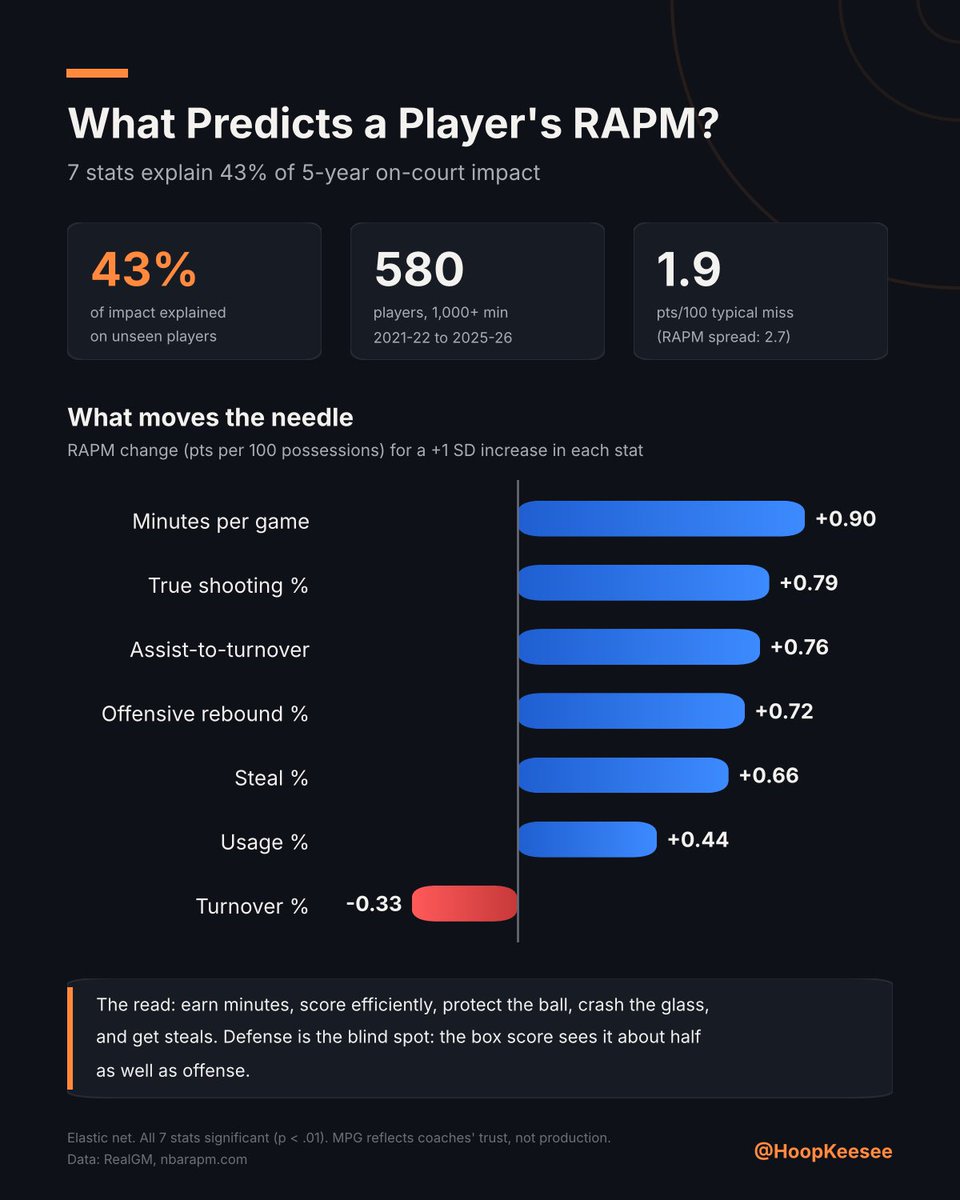
Here are the results when you place 7 of the main advanced stats against an NBA player’s 5-year RAPM.
Regularized Adjusted Plus Minus basically shows you how much a player affects Net Rating and On/Off after controlling for teammates.
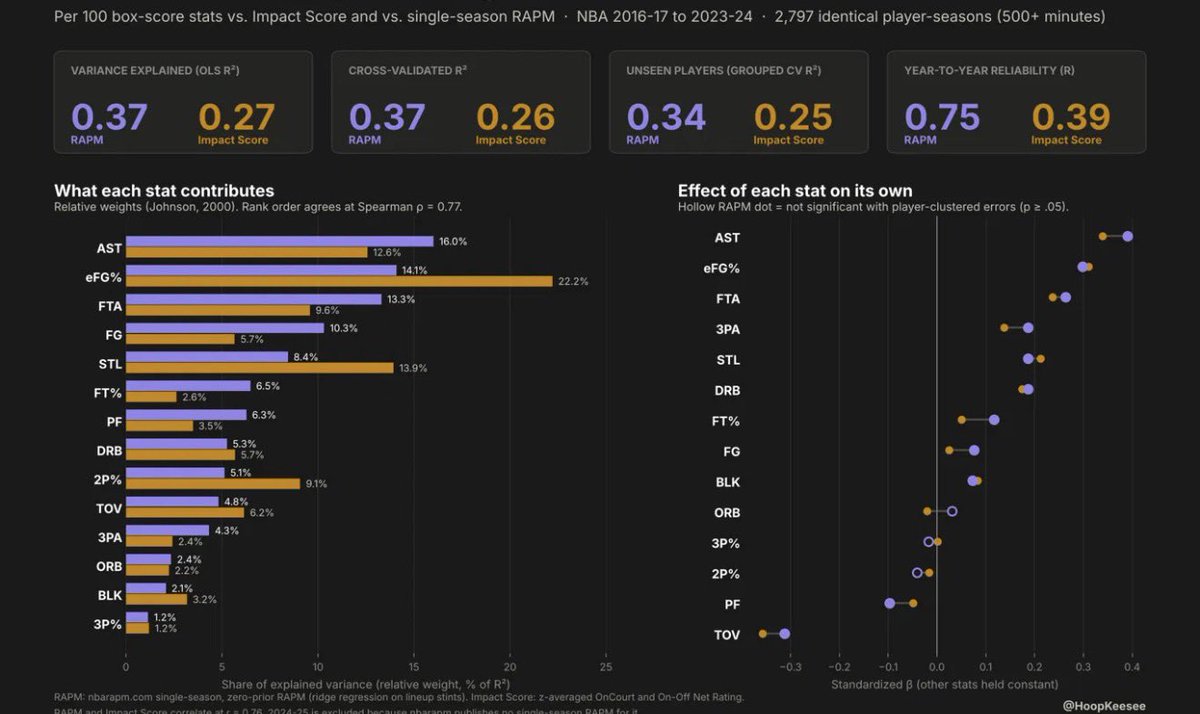
A better percentage variation explained, partly due to RAPM being more reliable as a variable on a YoY basis.
This model shows which stats matter the most to an NBA player being a Net Positive on the basketball court.
The model explains a little more than a quarter (26%) of the variance in Impact Score over the last 10 completed seasons. It’s valuable nonetheless for traditionally noisy variables like On/Off and Net Rating at the individual level.
The 6 largest drivers in the model are: eFG%, STL, AST, FTA, 2P%, and TOV.
This suggests that shooting efficiently, and generating a lot of assists and steals, relative to how often you turn the ball over yourself, is associated with greater Impact Scores.
I just wanted a variable that non-technical people could follow along with. I have RAPM in my database too. 2016-17 to 2023-24 seasons.
RAPM shares a 0.76 correlation with my variable, but the model with the same variables can explain 37% of variance for RAPM which is a noticeable bump from my original. Better YoY reliability too.
Still so much that isn’t explained though. That’s what I’ve been trying to look into more.
This model shows which stats matter the most to an NBA player being a Net Positive on the basketball court.
The model explains a little more than a quarter (26%) of the variance in Impact Score over the last 10 completed seasons. It’s valuable nonetheless for traditionally noisy variables like On/Off and Net Rating at the individual level.
The 6 largest drivers in the model are: eFG%, STL, AST, FTA, 2P%, and TOV.
This suggests that shooting efficiently, and generating a lot of assists and steals, relative to how often you turn the ball over yourself, is associated with greater Impact Scores.
It could be that. I think it’s also just that one player can only do so much. Your Net Rating and On/Offs are influenced by your teammates, coaching, etc. It can also include intangibles like communication on the court & defensive positioning which box scores can’t necessarily capture.
Amarri Monroe is one of the most underrated NBA prospects in the country despite being an older prospect.
All-time D1 steals leader for Quinnipiac at 6’7 220lbs, and led Quinnipiac and rebounds all 3 seasons. Also made 136 threes in 4 years, indicating comfortability from the 3 point line.
Best wing defender in the country with a respectable jumper. I think he’ll find an NBA role quite easily.
Around a quarter of a player’s Net Rating and On-Off values can be explained by just just 4 variables:
True Shooting %
A/TO
STL/TO
Total Rebounding %
Pretty significant foundation for traditionally noisy variables. Of course, other factors like teammates and system play a role.
This is a dataset of 531 players since the 2019-2020 season. I performed an elastic net regression to prevent model overfitting and cross-validated the model to get a 27% R^2 average.
I’m planning to add more variables to see if this increases prediction accuracy, but this is a solid start.
I ran a logistic regression on 986 draftees' last college season since 2005 to see what predicts whether or not they’ll ever become an All-Star.
It found weak signals in a couple of stats (AST/100, 2P%), but never tested draft position, and couldn't identify a single actual All-Star in its own test set.
I, therefore, evaluated draft position separately, and this is the most practical takeaway by far, though it may not be the most exciting. There is a significant exponential decay between draft selection and All Star Odds.
There’s decay among class as well, but that’s simply because freshmen typically get selected before everybody else. Once you control for selection, the class effect significantly reduces.
The main caveat is that All-Star status isn’t necessarily the best proxy for NBA success. I’m trying to find the best target variable that measures performance and controls for role.
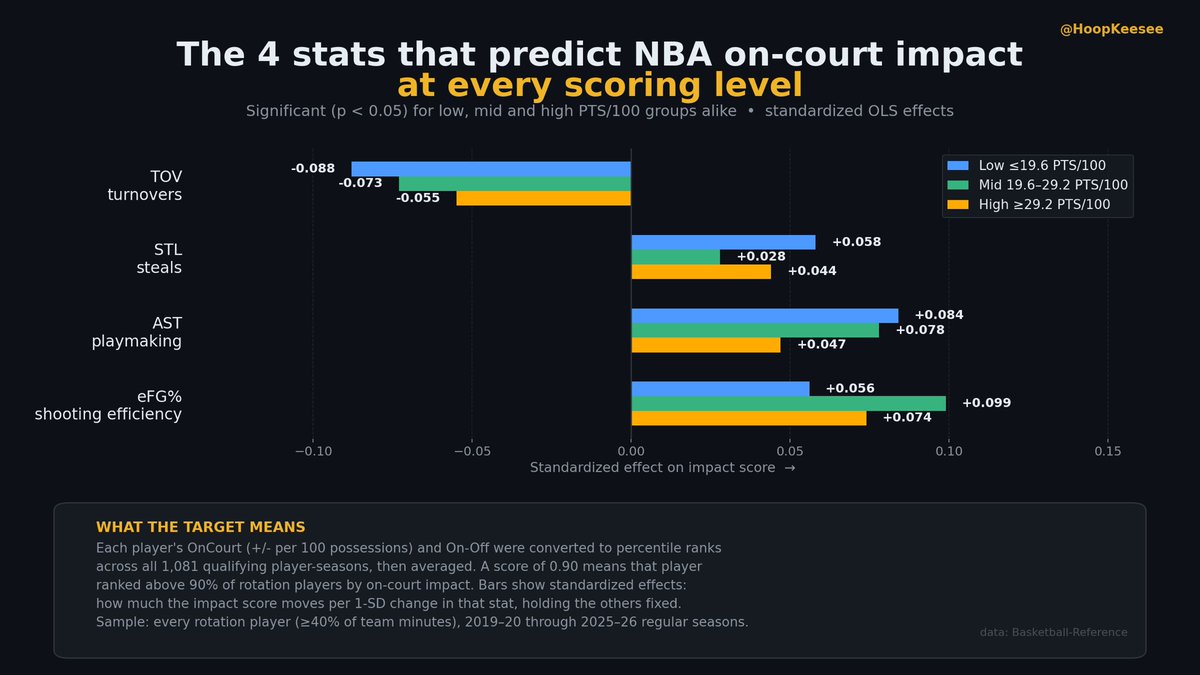
I ran predictive models for on-court impact among 1081 NBA player-seasons since 2019-2020. It’s moderated by PTS per 100
The target variable was a percentile-rank composite of OnCourt +/- and On-Off.
4 stats are significant in every usage tier: TOVs, STLs, ASTs, and eFG%.