Don't think you need to spend hours in front of the screens to trade profitably.
If you know how to build stuff, it only takes 20min/day to execute a trading system like momentum breakouts, and kill it while having a life 👇
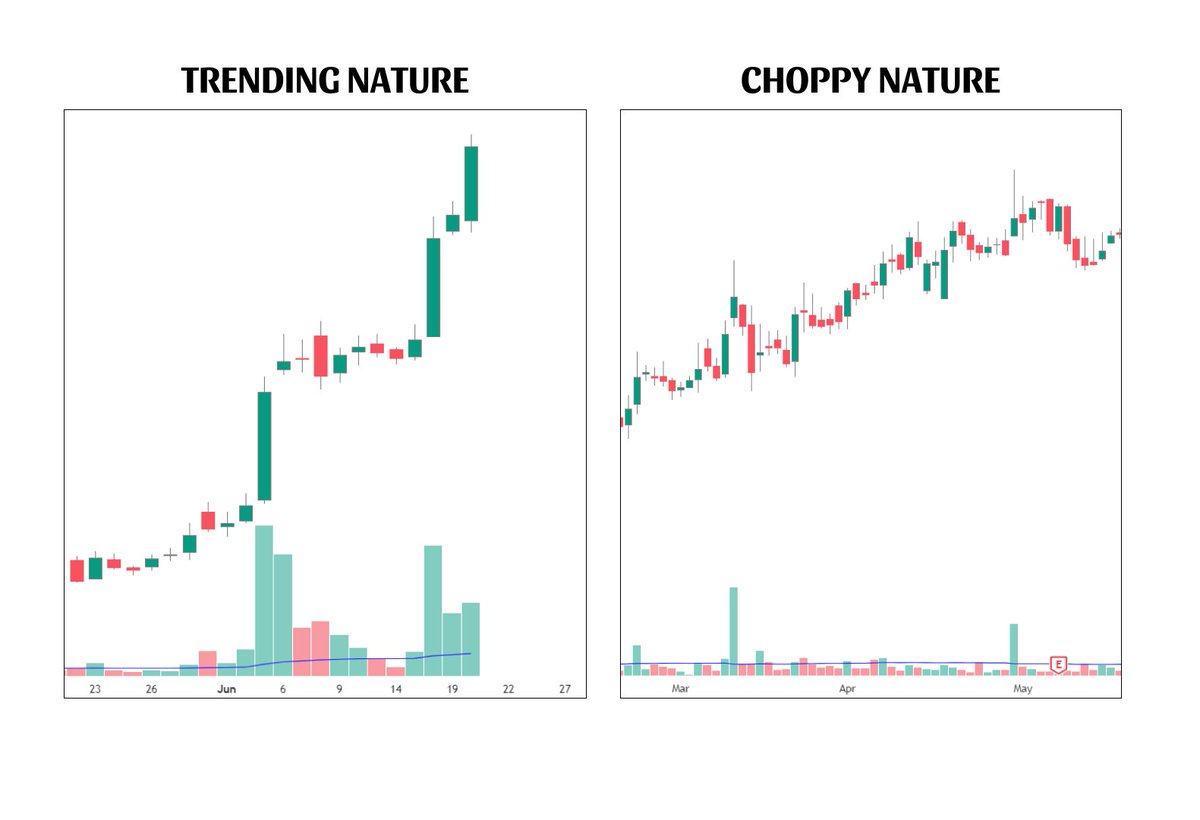
Choppy Vs Lineas Stocks
Every stock has a distinct personality and it rarely changes. Some stocks are "trending animals" that respect moving averages, produce large candle ranges, and show multiple full-range bars in sequence.
Others are "sloppy" with poor MA respect, small range candles, low ADR, and inconsistent buying pressure. Trade the former, avoid the latter.
#Trading
Want to know how to find future market leaders before they become obvious?
I start with one fundamental metric:
Earnings Per Share (EPS).
Always pay close attention to earnings every quarter.
Not just whether they beat earnings the pattern behind the earnings.
There are 3 things I look for every quarter:
1. EPS beat vs estimates
I want to see companies consistently beating expectations.
It tells me the business is executing better than what the market expected.
2. YoY EPS growth
I generally look for 25%+ EPS growth YoY, and ideally I want to see that growth accelerating quarter over quarter.
Many of the biggest market leaders show strong earnings acceleration before their biggest moves.
3. Forward EPS revisions
This is one of the most important and often overlooked.
After earnings, are analysts raising EPS estimates for the next quarter and full year?
When forward earnings expectations continue moving higher, institutions have another reason to keep accumulating the stock.
Beat + Growth + Raise.
Combine that with strong revenue growth, improving margins, a strong theme and Stage 2 price action and you have the characteristics I look for in potential market leaders.
Earnings are what move stocks over the long term.
In 1957, a professional dancer turned $36,000 into $2.25 million in just 18 months.
While touring the world.
Getting stock quotes days late by telegram.
His system was built around one simple idea:
- Stocks climb in boxes
- Price moves between a floor and ceiling
- When it breaks the ceiling, buy
- As the stock moves higher, new boxes form
- Raise your stop as the trend progresses
Nicolas Darvas wasn’t blindly buying every breakout either.
He looked for strong, active companies with improving fundamentals - then let price action tell him which ones the market was actually rewarding.
Fundamentals helped identify the opportunity.
Price confirmed it.
Risk management kept him in the game.
Darvas couldn’t watch the market all day. Being thousands of miles away from Wall Street forced him to ignore most of the daily noise and focus on what actually mattered:
Price. Volume. Earnings. Trend.
Being far from the noise wasn’t his handicap.
It was his edge.
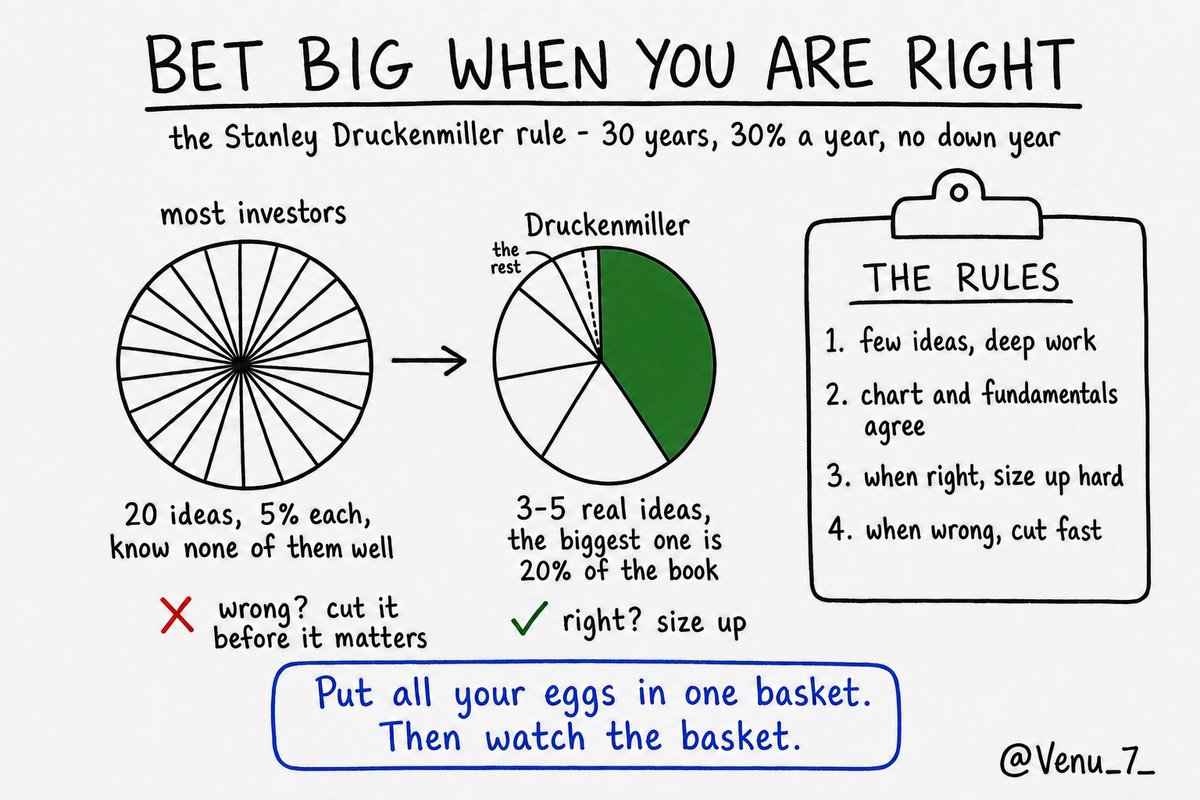
Stanley Druckenmiller ran Duquesne for 30 years.
30%+ a year. Not one down year.
His edge wasn't being right more often. It was what he did when he was right.
- Diversification is for people who don't know what they own
- Find the 3-5 ideas you understand better than anyone
- Let the best one be big. His top holding today is 20% of the book.
- When the fundamentals and the chart agree, size up hard
- When you're wrong, cut it before it matters
That's it.
"It's not whether you're right or wrong. It's how much you make when you're right and how much you lose when you're wrong."
Put all your eggs in one basket. Then watch the basket.
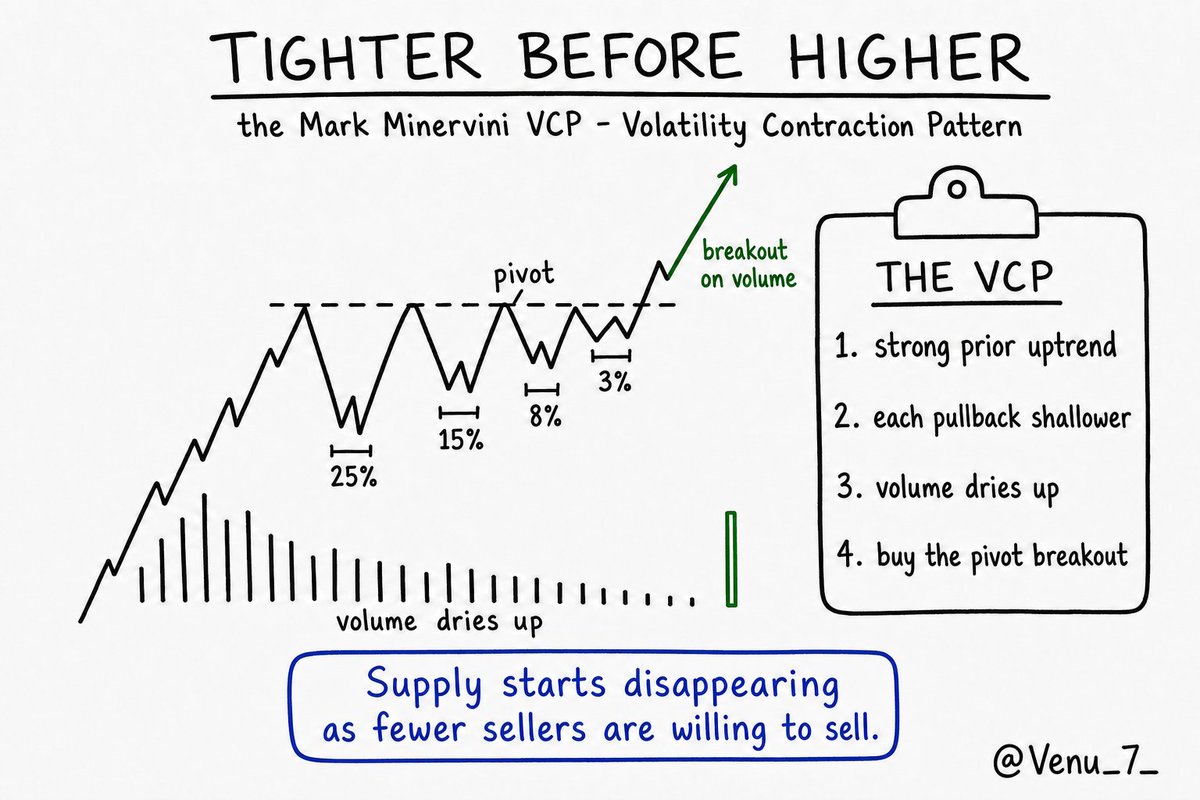
In 1997, Mark Minervini won the U.S. Investing Championship with a 155% return.
Stocks only.
One of the most important patterns behind his approach is something you can spot on almost any chart:
- Strong prior uptrend
- Each pullback gets smaller: 25% → 15% → 8% → 3%
- Volume dries up as price gets tighter
- Supply starts disappearing as fewer sellers are willing to sell
- Breakout through the pivot as demand returns
Each contraction tells you something: sellers are becoming less aggressive, while buyers are willing to step in at progressively higher levels.
He calls it the Volatility Contraction Pattern (VCP).
The idea is simple:
When a stock refuses to go down while volume dries up, pay attention.
It may be moving toward the point of least resistance.
Tighter before higher.
William O’Neil’s Double Bottom is one of the classic patterns for identifying a potential trend change.
The Double Bottom is the classic W base:
- Stock pulls back after a strong run, bounces, then sells off again
- The second low undercuts the first, shaking out weaker holders
- The middle peak of the W stays below the left-side high
- The base typically needs at least 7 weeks and is usually 35% deep or less
- Buy point: $0.10 above the middle peak, ideally with volume at least 40% above average
You don’t wait for the old high.
Clearing the middle of the W signals that demand has absorbed the second selloff.
That’s what makes this pattern so useful - it can signal the transition from a downtrend into a new uptrend.
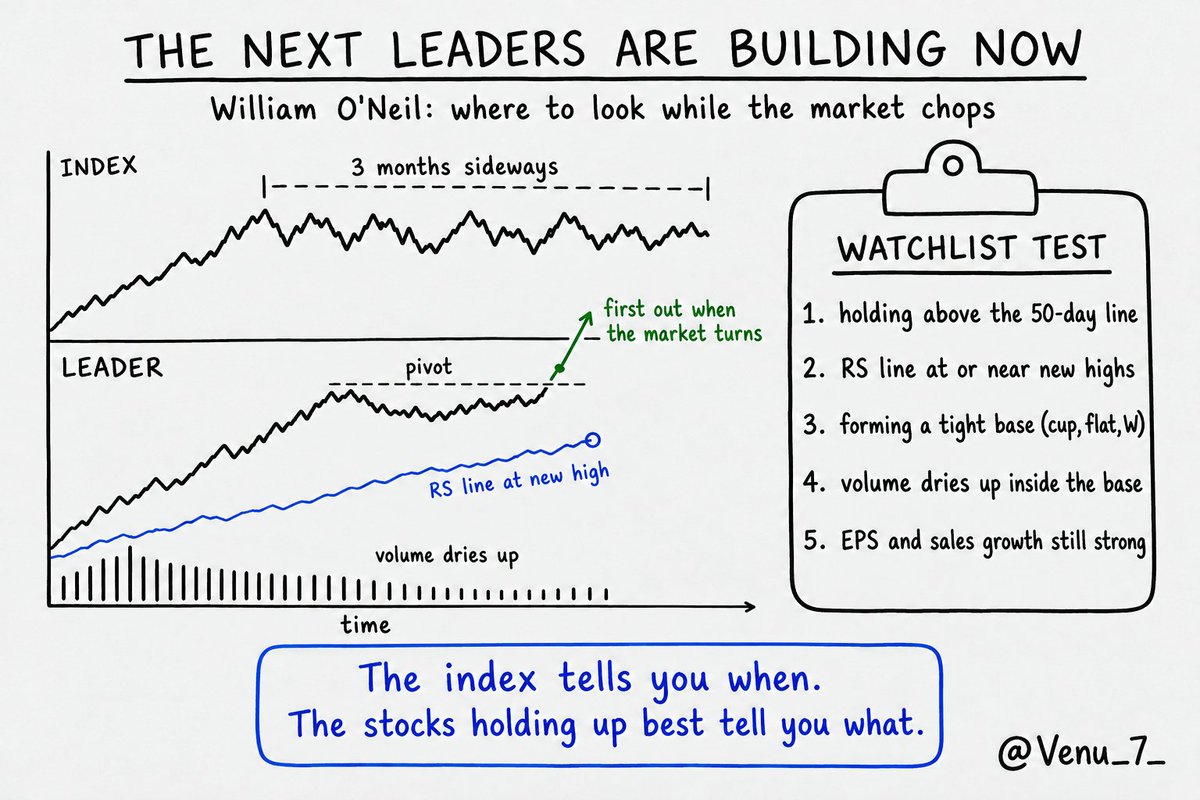
The index has gone sideways for three months.
Most people see that as dead money.
William O'Neil saw it as the most important research window of the cycle.
While the market chops, the next leaders are quietly building bases. When the market turns, they are the first stocks out.
Here is what to look for:
- The stock is holding above its 50-day line while the index struggles
- Its relative strength line is at or near new highs, meaning it is outperforming a flat market
- It is forming a recognizable base near its highs: cup with handle, flat base, or double bottom
- Volume dries up inside the base. The sellers are running out.
- Earnings and sales growth are still accelerating underneath
That is your watchlist for the next leg:
$NBIS $SMTC $INTC $BE $GLW $CRM $NOW $PLTR $ABNB $FIVN $TEAM $CRWD $NET $TWLO $FROG $FTNT $PANW $RBRK $HPE $DELL $HPQ $ANET $APH $COHU $MRVL $AMD $NVDA $MU $SNDK $U $NTAP $FORM
You do not need to predict when the market turns. You need to have the list ready for when it does.
The index tells you when.
The stocks holding up best tell you what.
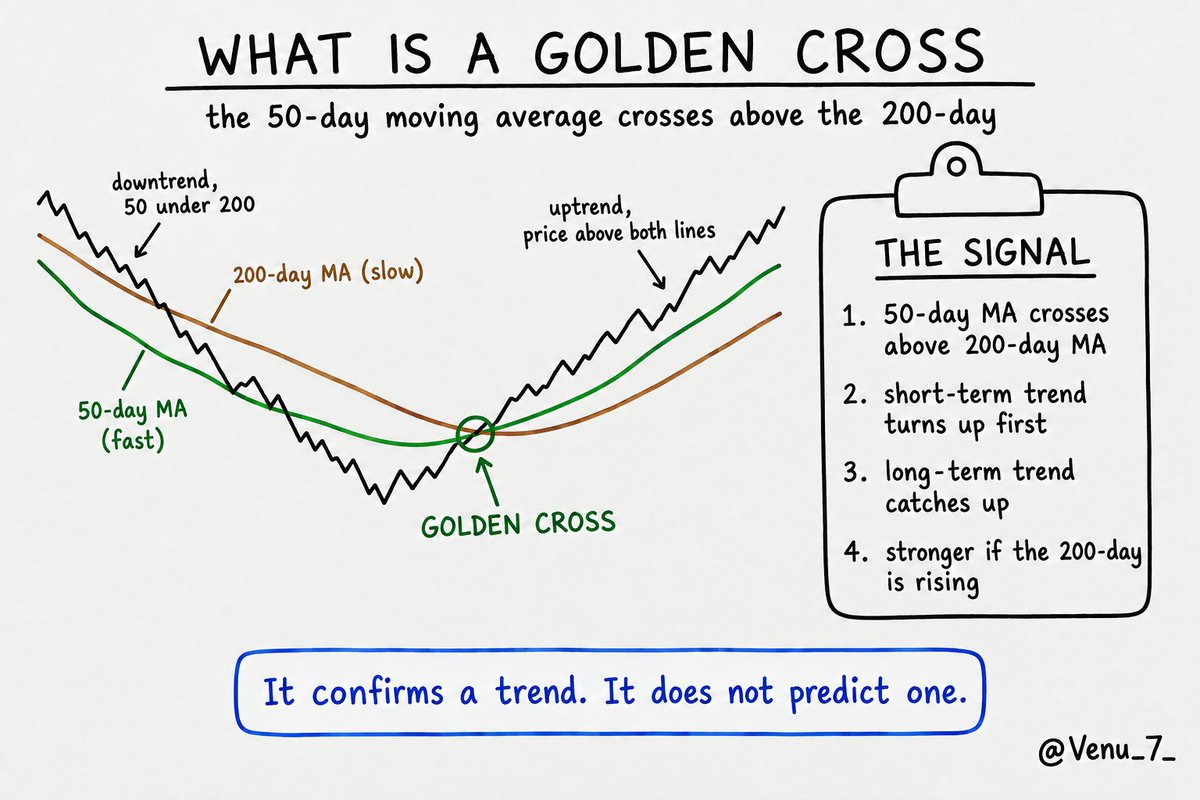
What is a Golden Cross in Technical Analysis? 🧵
A Golden Cross happens when the 50-day moving average crosses above the 200-day moving average, signaling that the longer-term trend turning bullish.
Here are 10 stocks printing a Golden Cross:
jim simons on the moment he stopped trading on fundamentals and started building models. the models went on to return 66% a year before fees for 30 years:
"you never know quite where you stand. you come in one morning, your position is way up. you say, oh, I'm a genius. the next day it's down. I'm a dope. the reality is you're not really a genius, you're not really a dope. but the volatility was too high."
"making models on the other hand, if you could find some statistically significant factors, that was great. not only for the satisfaction of making some money but just the thrill of finding a new predictor. you run the simulation and you see, oh my goodness, this is a real statistical advantage, and it's independent of the other ones, and you build up the system that way."
"the risk control things, dumb things maybe, but how to model, for example, the right way to model costs. we found what I consider the right way to do this modeling. when we started, there was nobody else doing that."
one independent predictor stacked on the next, the cost models nobody talks about. that process became medallion, an estimated $100 billion in trading profits, the most profitable hedge fund in history.
Want to Know If the Market Is Topping or Just Resetting for the Next Leg Higher? Read this.
Stan Weinstein’s framework gives us one of the simplest ways to answer it.
The Nasdaq ran 34% from the March low to the June high.
Then it spent three months going nowhere.The key is the 30-week moving average.
Stage 2 pause:
- 30-week MA still rising
- Price holds above it, pullbacks find support near the line
- Down weeks come on lighter volume
- The range eventually resolves higher
Stage 3 top:
- 30-week MA flattens out
- Price whips above and below the line
- Heavy volume shows up on down weeks
- Rallies keep failing at the same level
Right now, $QQQ sits above a 30-week line that is still rising.
By Weinstein’s framework, that looks more like a Stage 2 pause than a Stage 3 top.
That can change. The line flattening is the tell.
Until it does, the trend gets the benefit of the doubt.
Sideways above a rising line = pause.
Sideways through a flat line = potential top.
The market doesn’t need to go up every week to remain in an uptrend.
Sometimes the strongest moves come after months of doing nothing. We’ve seen this again and again - October 2023, April 2025, November 2025, and March 2026 are some of the best examples.
Until the 30-week MA tells us otherwise, the primary trend remains intact.
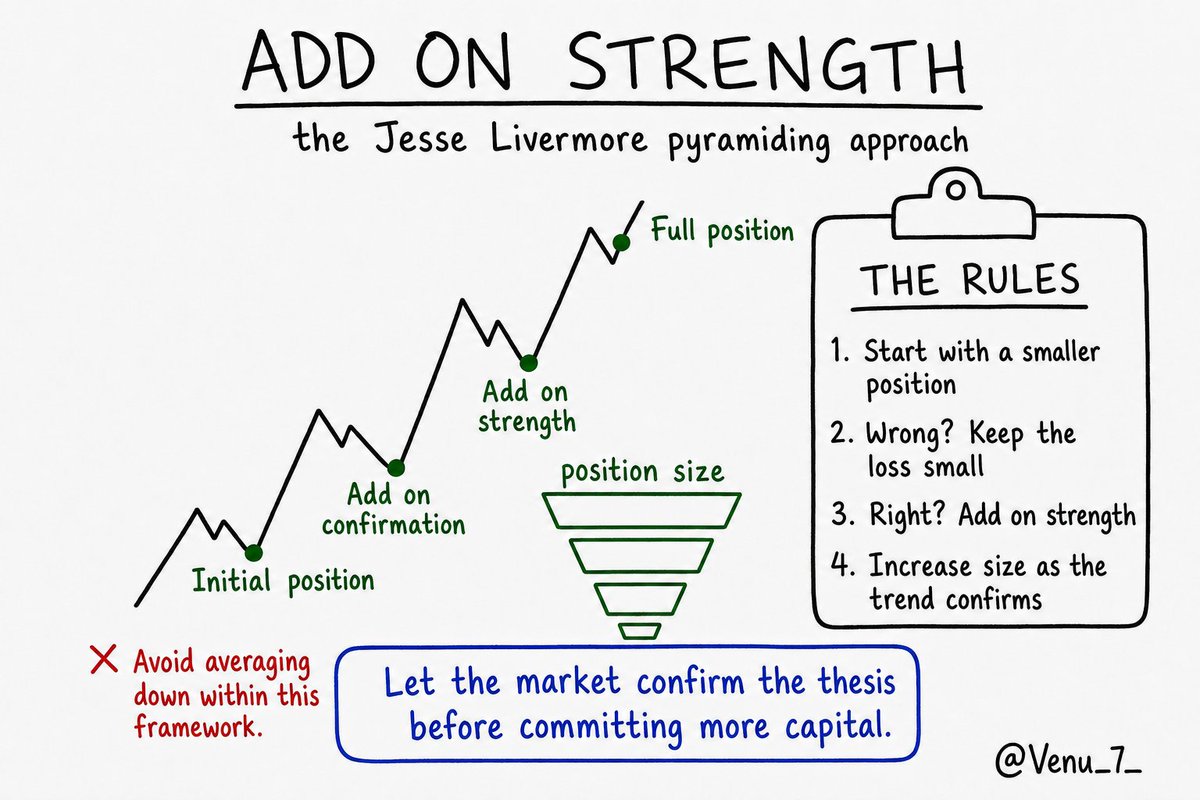
Jesse Livermore’s approach to position sizing was built around confirmation.
Rather than building a full position immediately, his approach was to increase exposure as price confirmed the trade.
- Start with a smaller initial position
- If price moves against the thesis, keep the loss small
- If price confirms the thesis, add on strength
- Continue increasing size as the trend develops
- Avoid averaging down within this framework
The advantage is simple: your smallest exposure is when uncertainty is highest, while your largest exposure comes after the trend has provided more confirmation.
This isn’t the only way to build a position. Long-term investors and different trading styles may use very different approaches.
But within Livermore’s framework, the objective wasn’t to get the lowest possible entry.
It was to commit more capital as the market provided more evidence that the trade was working.
I watched this old Warren Buffett interview and what struck me most wasn’t that Berkshire traded around $3,900 a share back then and is worth hundreds of thousands today. It was how little of what he said actually feels dated. He was 57, worth about $2 billion, and speaking only months after the 1987 crash.
His explanation of valuation was incredibly simple. A bond tells you what it will pay you, while a business does not, so as an investor you have to figure that number out yourself. That sounds basic, but that is really the whole game.
Most investors start with the stock price, the chart, the excitement, what everyone else is talking about, and then try to justify it afterwards. Buffett did the opposite. He started with the economics of the business and then asked whether the market was offering those economics at a price that made no sense.
The Washington Post example is probably the cleanest. The entire company was selling for around $80 million while Buffett believed the properties were worth something closer to $400 million. He invested less than $10 million and years later that position was worth hundreds of millions.
GEICO was similar. Berkshire bought a huge piece of the company for a fraction of what that ownership eventually became worth. See’s Candies cost just $25 million and eventually reached the point where it could earn more than the original purchase price in a single year.
The part I found even more interesting was how skeptical Buffett already was of financial products that encouraged more speculation. His view was basically that if new instruments make other people behave more foolishly, that can actually be good for the patient investor. You do not need to participate in every new game, you just need to be there when everyone else occasionally loses their mind.
Think about how relevant that is today. We now have 0DTE options, perpetual futures, prediction markets, nonstop financial media and a casino sitting in everyone’s pocket. The tools changed dramatically, but human behavior really did not.
There is also a great section where he talks about inheritance. Buffett had no interest in creating generations of people who never needed to accomplish anything simply because their parents happened to be rich. His view was that most of his fortune should eventually go back to society rather than become some permanent family entitlement.
He also bought Nebraska Furniture Mart from Rose Blumkin largely on trust and a handshake. No massive due diligence army, no giant consulting report, no endless process. He understood the business, believed in the person running it and acted.
That is probably what I like most about old Buffett interviews. His edge was never making investing more complicated than everyone else. It was reducing it down to a few things that actually mattered and ignoring almost everything that did not.
Understand the business, estimate what the economics are worth, wait for a price that gives you a large margin of safety and then have the patience to sit there. The interview is decades old, but almost none of that needs updating. 🌹
Steve Jobs founded Apple. He spent decades building Apple to becoming the most valuable company in the world. In the end , Apple only contributed $2 billion to his wealth
Now look at a man who never worked a single day at Apple. Warren Buffett invested in Apple between 2016 and 2018 when the stock was very undervalued.
That purchase has netted Buffett over $100 billion in profit. He wrote no code. He shipped no product. He sat in Omaha and held.
Now Microsoft.
Bill Gates built it from nothing. He is worth about $114 billion today, after giving away close to $100 billion in his lifetime. A staggering fortune by any measure.
But, his former assistant, Steve Ballmer is now worth about $179 billion. Ballmer did not found Microsoft. He was employee number 30, and received no equity when he joined.
He negotiated a stake, became CEO, retired in 2014, and then did the one thing almost nobody does. He never sold. Today, he owns about 4% of the company. Gates owns less than 1%.
The employee is now $65 billion richer than the founder.
Most people believe there is only one road to serious wealth. Start a company. Sacrifice a decade of your life. Out-work everyone. That road is real, but it is brutal, and most who walk it never make it.
The much simpler , less stressful way to build wealth is to buy shares of companies that are already the best in the world . The stock market allows us to do just that.
You can simply buy a slice and become an owner beside the founder, while keeping your day job.
But do not confuse simple with easy. Ownership only compounds if you do three things:
https://t.co/VhIvjH39UA great businesses, the top 1% in the world, not exciting stories.
https://t.co/TdZ5mA6Ltx them when Mr. Market panics and marks them below their intrinsic value.
3.Then do the hardest thing in investing, which is nothing.
Ballmer did not out-invent Gates. He simply out-held him.
You do not have to found the next Apple to get wealthy from it. You just have to own it, and keep owning it.
Mark Minervini is one of the most successful and respected traders of our time, particularly known for his disciplined approach to momentum and growth-stock trading.
His two books are like diamonds for anyone serious about trading:
1. Think & Trade Like a Champion
2. Trade Like a Stock Market Wizard
My own trading has improved significantly after reading his books and following his insights on X.
Many of my successful trades have also been inspired by the VCP (Volatility Contraction Pattern) and the principles he has shared over the years.
Here are 10 key Minervini principles, presented as practical lessons that can be applied to improve your own trading process while staying true to the core philosophy of his approach.
@markminervini
#VCP
#Trading
#positionaltrading
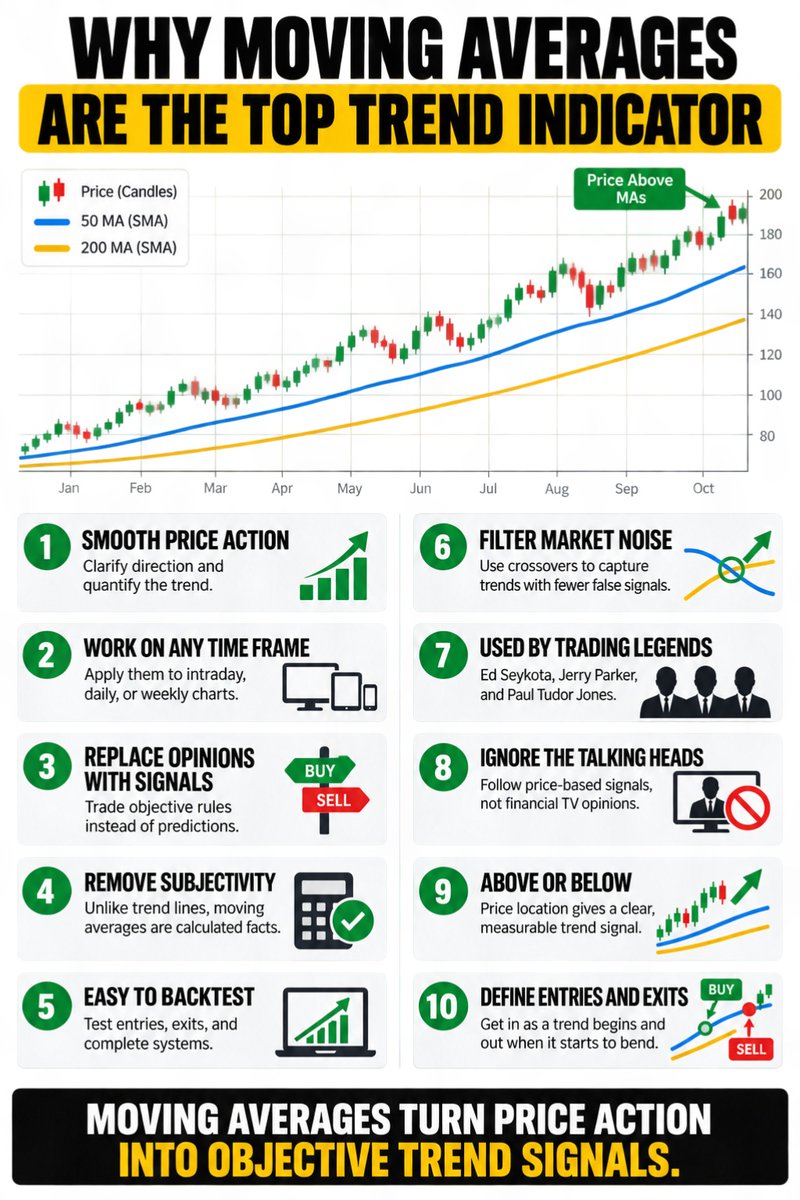
Why Moving Averages are the Top Trend Indicator:
I like moving average signals for their power and simplicity in trend trading, and here is why:
1. Moving averages are a way to smooth price action and quantify a trend.
2. Moving averages are tools that can be applied to any time frame.
3. They can remove your predictions and opinions from your trading and replace them with moving average signals.
4. Unlike trend lines, moving averages are quantifiable facts, not left to interpretation.
5. Moving averages are simple to use to backtest systems.
6. You can combine multiple moving averages in crossover systems to filter out noise and volatility and capture trends with fewer false signals.
7. Many legends mentioned using moving averages in their trading, such as Ed Seykota, Jerry Parker, and Paul Tudor Jones.
8. Moving averages are better 'gurus' to follow than the talking heads on financial television.
9. You can’t argue with the facts. Either price is above or below them.
10. They have made me a lot of money during trends by using quantified signals to get me in when the trend begins and get me out at the end, when the trend starts to bend.
15 years ago in my trading career, I made a simple mistake:
I traded almost every stock that formed something that looked like a breakout base.
I knew the patterns.
But I didn't understand the details that separate an average base from an exceptional one.
Today, I can reject many breakout setups within seconds.
Before I even think about an entry, I zoom out.
Here is what I look for:
1. Prior advance: I want real momentum. Ideally, the stock has already advanced 70–100%+ over the previous weeks or months. Many of my biggest winners were already 100%, 200%, 300% or even 500% above their 52-week lows.
2. Stock character: I love stocks that move like staircases. Strong momentum move → tight consolidation → another strong move. I avoid stocks that constantly swing violently in both directions.
3. Base quality: I want clean price action and contracting volatility. The tighter and cleaner the consolidation becomes, the more interested I get. Repeated fake breakouts and wild swings are warning signs.
4. Breakout level: I prefer a clean horizontal breakout line or even slightly declining resistance. If the stock keeps drifting higher throughout the base, the entry becomes much more difficult for me.
5. Volume: Ideally, volume contracts as the consolidation develops. I want to see activity dry up rather than constant heavy trading throughout the base.
6. The complete picture: I never judge the base in isolation. Fundamentals, story, relative strength, liquidity and my conviction in the stock still matter.
This is why simply knowing the names of chart patterns isn't enough.
You can learn what a flat base, VCP or cup-and-handle looks like relatively quickly.
But recognizing the small differences between an average setup and an exceptional one takes thousands of charts.
You have to train your eyes.
That's why I have studied historical winners for years and built my own model books.
The goal is to reach the point where a sloppy setup almost feels wrong when you look at it.
Look at these 4 charts.
Two have the characteristics I want.
Two don't.
Which two would you trade—and what detail gave you the answer?
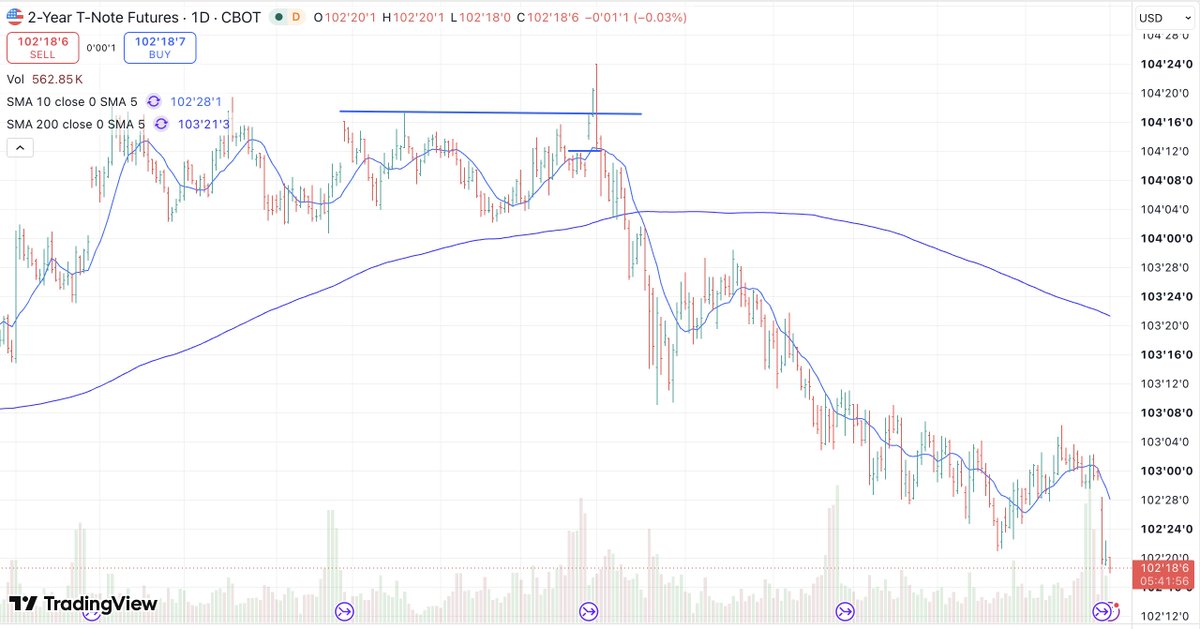
As promised here's my worst trade of the year in terms of both just getting it DEAD wrong and P&L. I did a post earlier on how I marry technicals with fundamentals here:
https://t.co/3p7xW5A8zA
This checked the boxes as I was of the view that rates would come down (still am, I know totally non consensus and not important as I was, and currently still am, dead wrong). Either way we had a nice base in the 2yr forming so got in on the cheat (it didn't gap but this backadjusted chart is kinda funky) and then added size in the overnight market as it broke out. I thought post the Iran madness that treasuries would get a flight to quality and trade should be a layup and was pretty much wrong from the second I added.
The mistake I made was not to reduce IMMEDIATELY, particularly when the add didn't work right away. It was the overnight market and I was actually headed out for a the evening and was more concerned to get MORE on rather than weighing the risks of not being able to monitor it closely which was a mistake. By morning I was already stopped on a portion for more than I should have been and stagger stopped my way out of the rest that day for more than a -200BP loss. It should have been half that at the worst. Thank goodness I did though as first loss in this case was still the best loss as anyone arguing with the rates market has gotten taken to the woodshed.