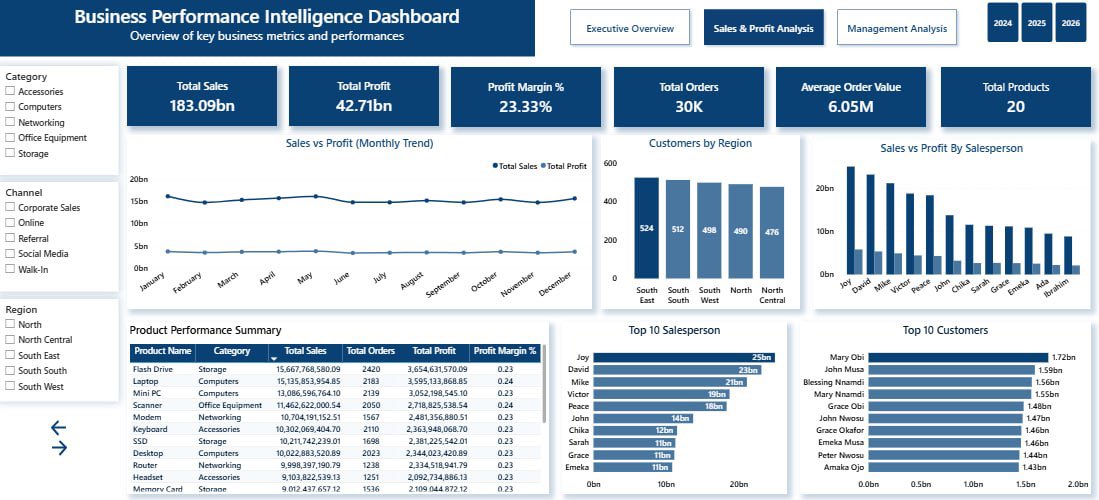
so far, so good. i can’t wait to finish designing this dashboard.
thanks to @Ifexaacademy@paulifeanyi_G because this challenge is really pushing me out of my comfort zone and making me think harder while solving business questions.
#datafam#powerbi#dashboard
I finished another Power BI project 📊
I built a Business Performance Intelligence Dashboard to explore sales, profitability, customers, products, and segment performance.
A few things stood out:
• Computers led revenue
• Retail was the strongest customer segment
++
#datafam
Day 14 @Ifexaacademy, I learnt how DAX can be used to turn static insights into dynamic insights in Power BI dashboards.I was introduced to the concept of concatenation using the & symbol. DAX make dashboards responsive to data. #DataAnalysis#PowerBI#WomenInTech#DataAnalyst
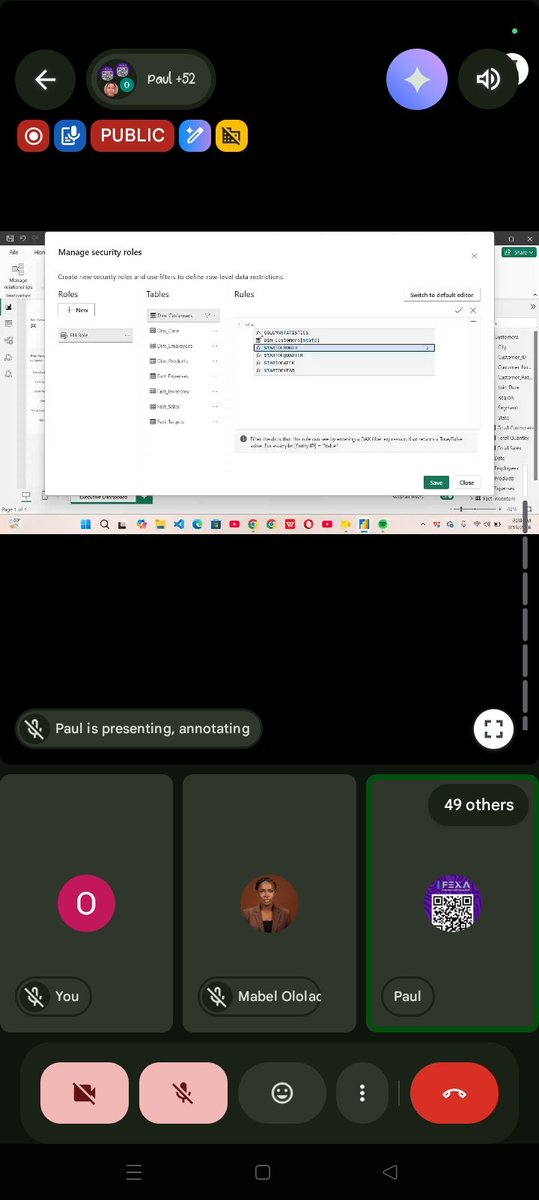
Day 13 @Ifexaacademy,I learnt about Row-Level Security (RLS) in Power BI a feature used to control the data different users can access.I learnt how to create security roles and use dynamic RLS to ensure that users only see the information relevant to them. #DataAnalysis#PowerBI
Day 16 of learning Data Analysis with @Ifexaacademy covered;
-Building a new dashboard from start(crime data set)
-Did some basic measure
THOUGH STUFF BUT WE TRUST GOD
A thread on what I learned in today's Power BI session
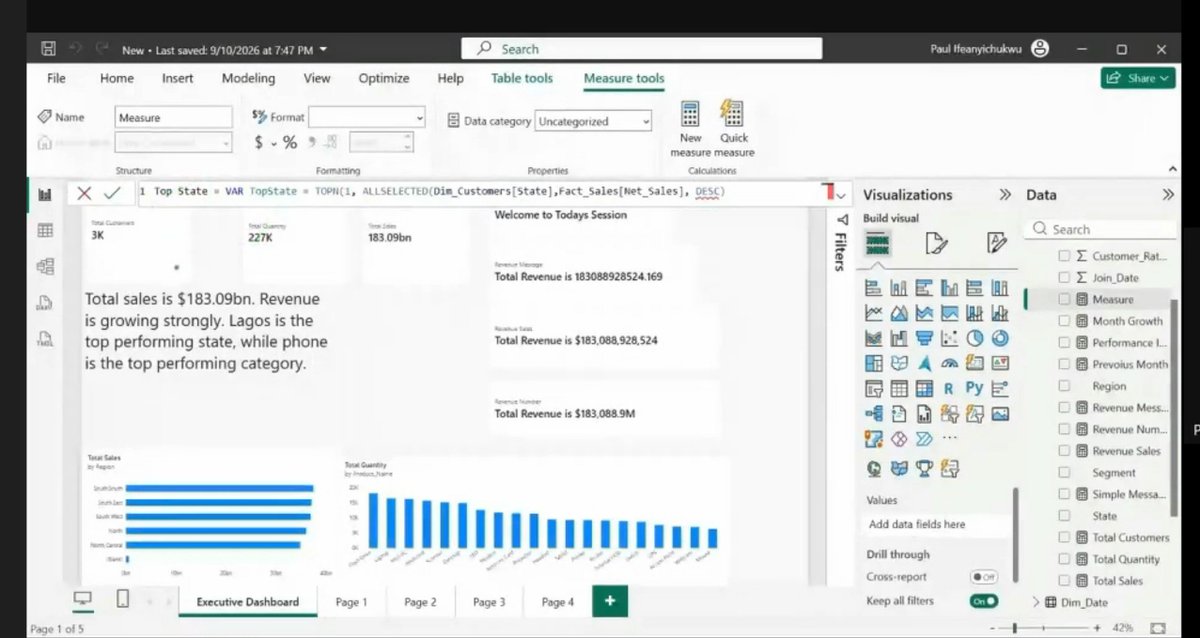
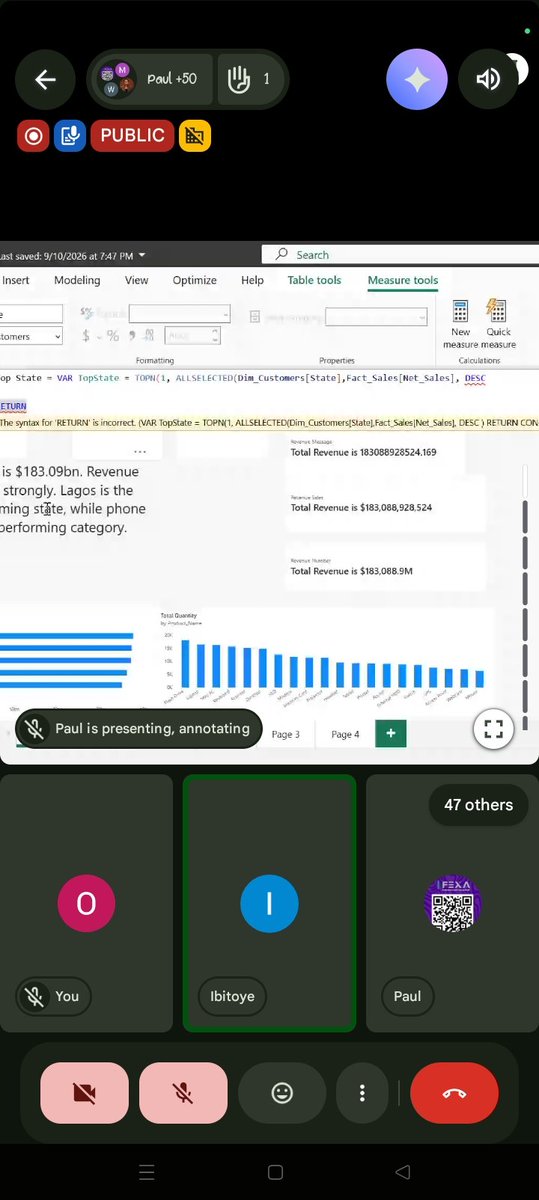
1.We built a "self-narrating" dashboard, one that explains itself in plain English instead of making you interpret charts.
Day 13 of learning Data analytics with @Ifexaacademy Covered:
-RLS: Role level security and its types
-Statics RLS
-DYNAMIC RLS
-Steps of navigating and activate RLS
THOUGH STUFF BUT WE TRUST GOD
Day 13 of learning Data analytics with @Ifexaacademy Covered:
-RLS: Role level security and its types
-Statics RLS
-DYNAMIC RLS
-Steps of navigating and activate RLS
THOUGH STUFF BUT WE TRUST GOD
A thread on what I learned in today's Power BI session
1.We built a "self-narrating" dashboard, one that explains itself in plain English instead of making you interpret charts.
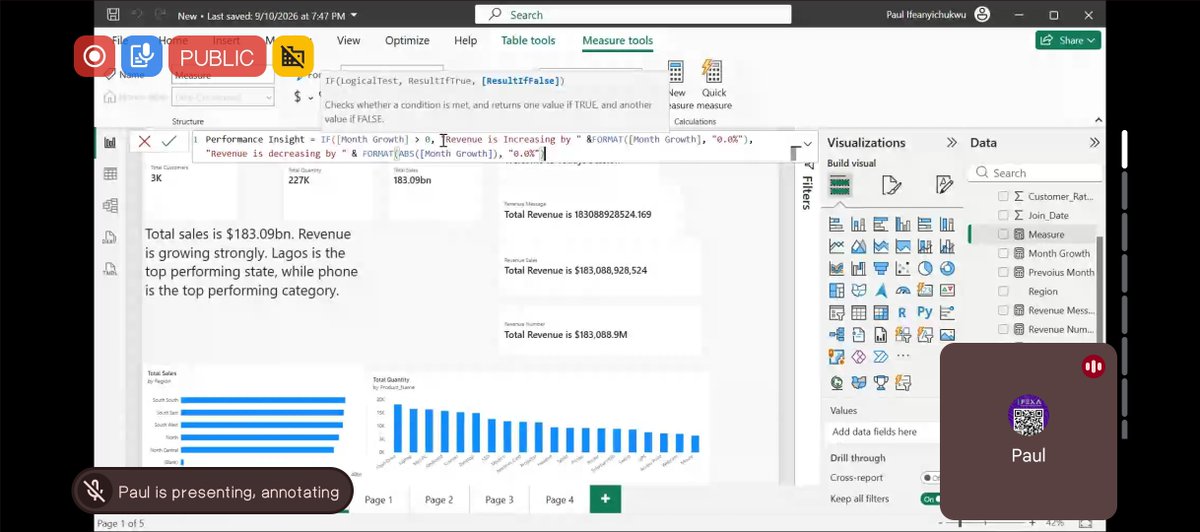
@Ifexaacademy@we_work_remote 2.The magic is a DAX measure using IF() logic:
IF(Growth > 0, "Increasing by X%", "Decreasing by X%")
3.Add FORMAT() to turn decimals into clean percentages, and ABS() to keep negative numbers readable in sentences.
@Ifexaacademy@we_work_remote 4.Result: instead of "-0.12," the dashboard says "Revenue is decreasing by 12%." Way easier for stakeholders to digest at a glance.
5. Small DAX tricks, big UX difference. This is the kind of detail that separates a good dashboard from a great one.
#PowerBI#DAX#DataAnalytics
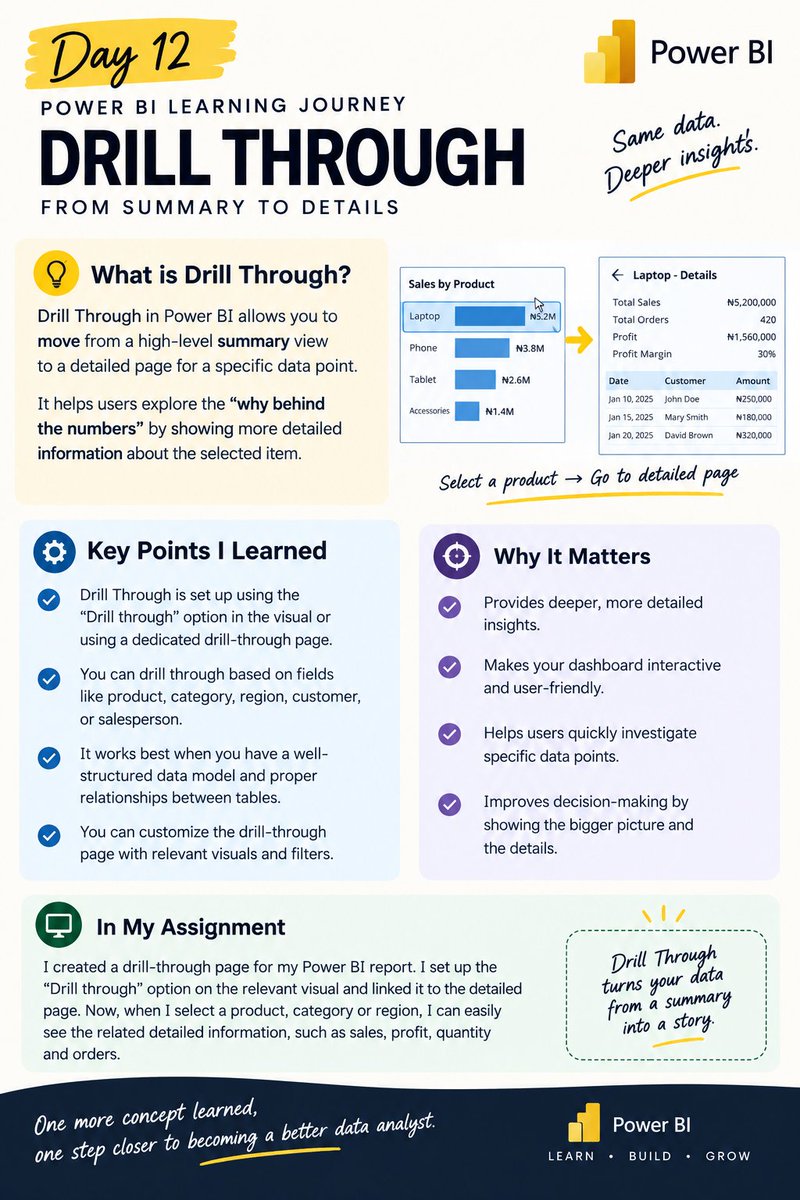
Day 12 @Ifexaacademy , I learnt about Drill Through in Power BI-a feature that allows you to move from a summary view to a detailed page focused on a specific data point.I learnt how it can be used to explore the details behind selected data making dashboards more interactive.
Day 11 @Ifexaacademy was all about making a Power BI dashboard more interactive & user-friendly.I learnt how to:Format dashboards professionally, Create & customize tooltips, Add page navigation using buttons,Connect multiple dashboard pages & Use filters to improve interactivity
Completed Day 6 assignment of at @Ifexaacademy data analysis training
FILTER function in Excel.
Created 5 dynamic sheets:
✅ Anambra Sales
✅ High Quantity (>10)
✅ South East + Qty > 5
✅ Accessories + Sales > ₦100k
✅ Advanced: 3 conditions
All formulas worked perfectly.
Day 12 of learning Data analytics with @Ifexaacademy covered:
-Creating tables in power BI and its purpose
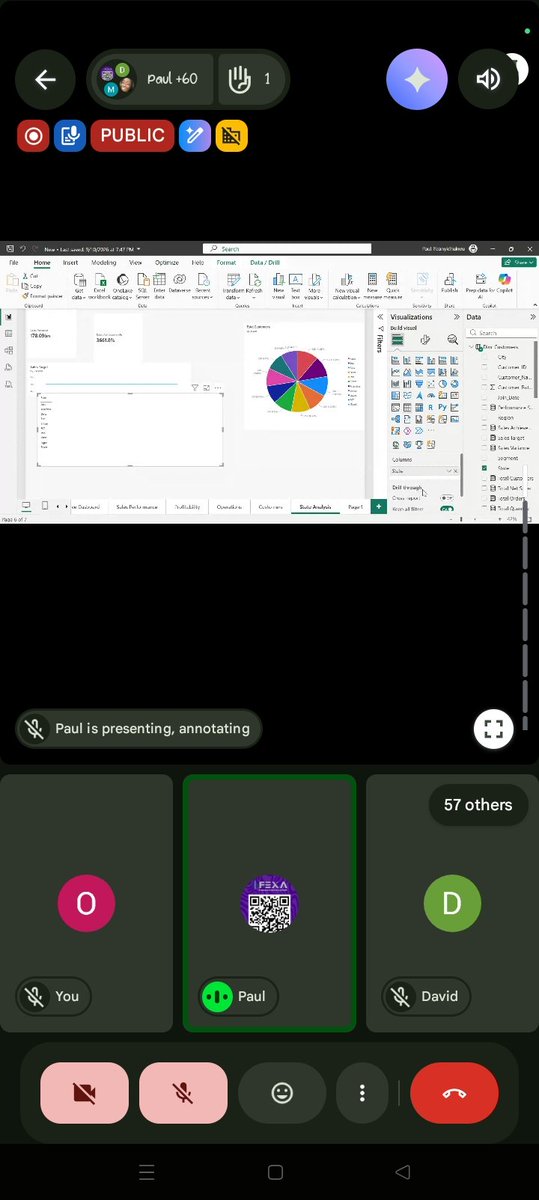
-Drill through and its purpose
-Calculating variances(Total profit - Targets)
THOUGH STUFF BUT WE TRUST GOD