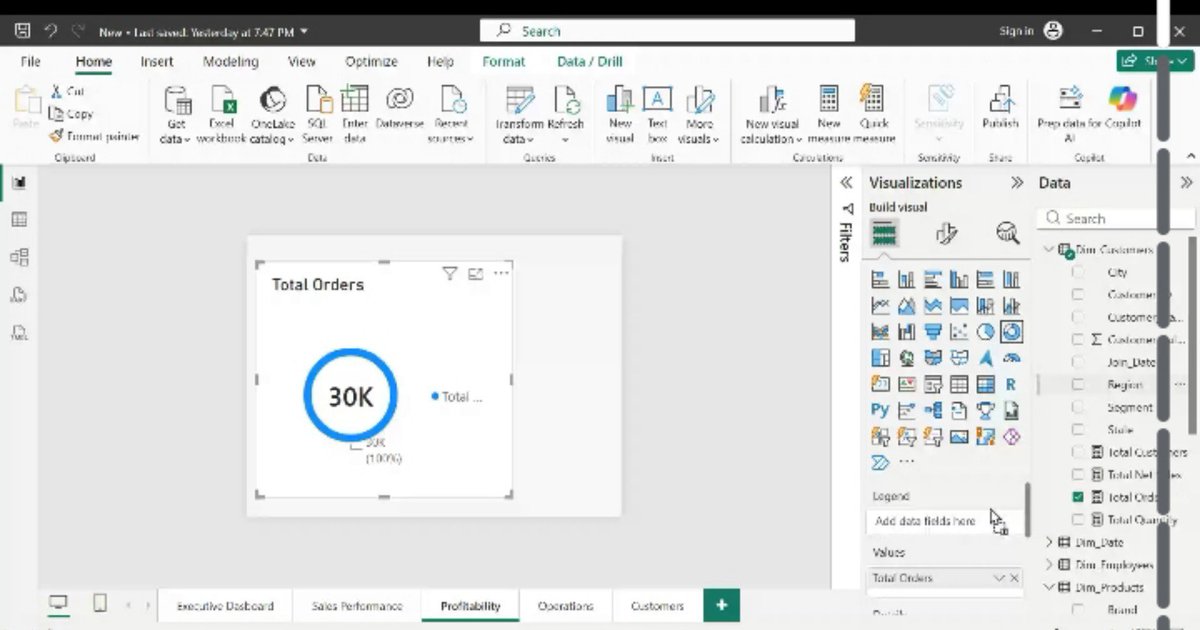
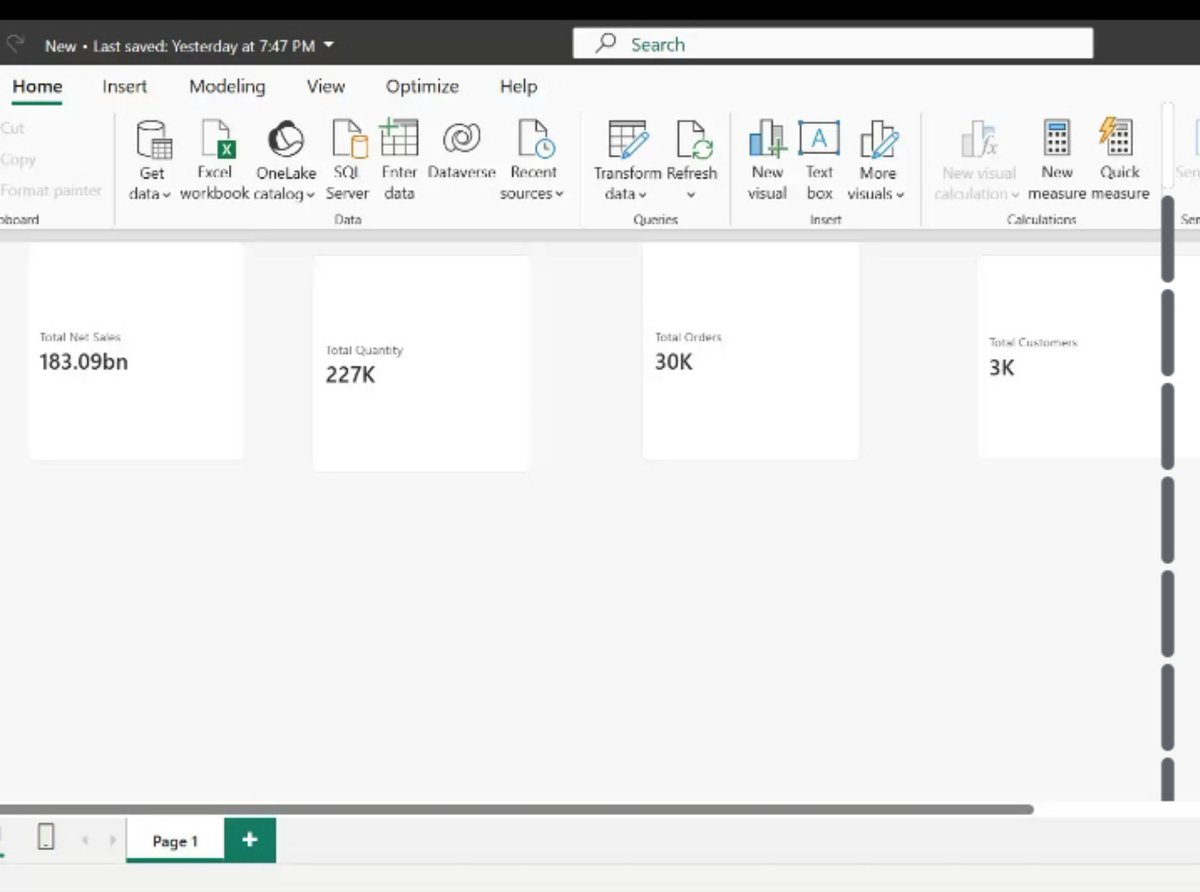
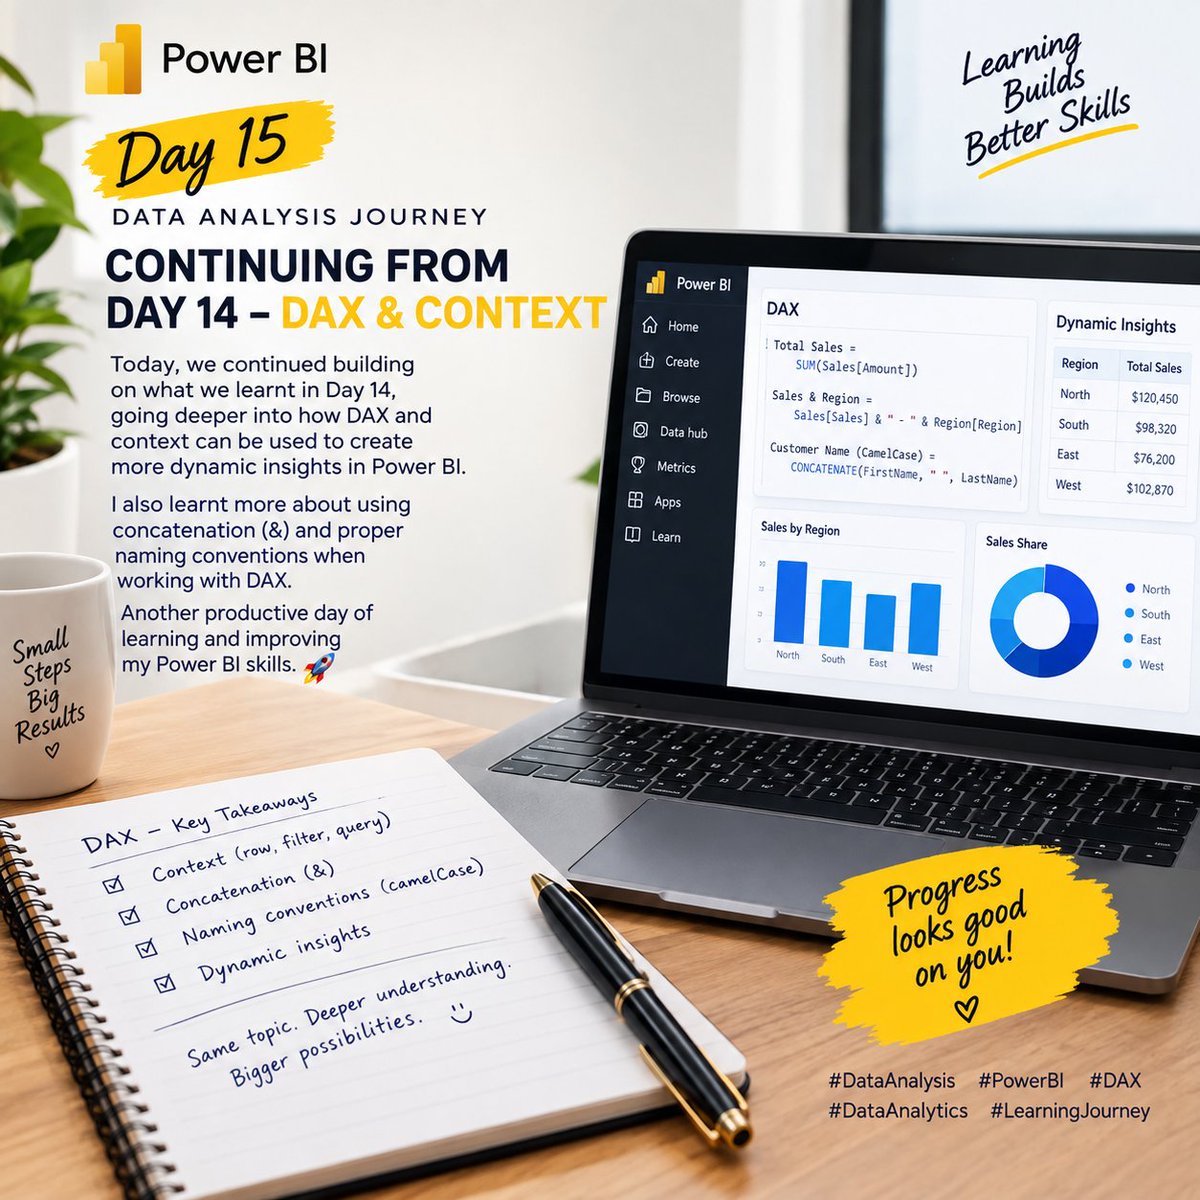
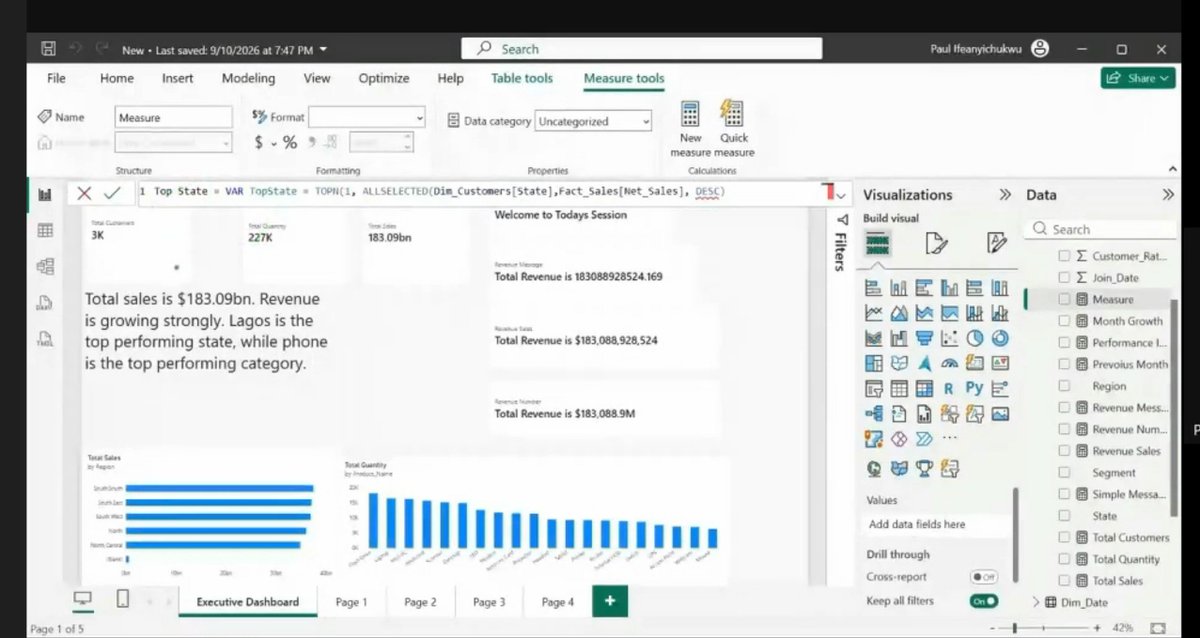
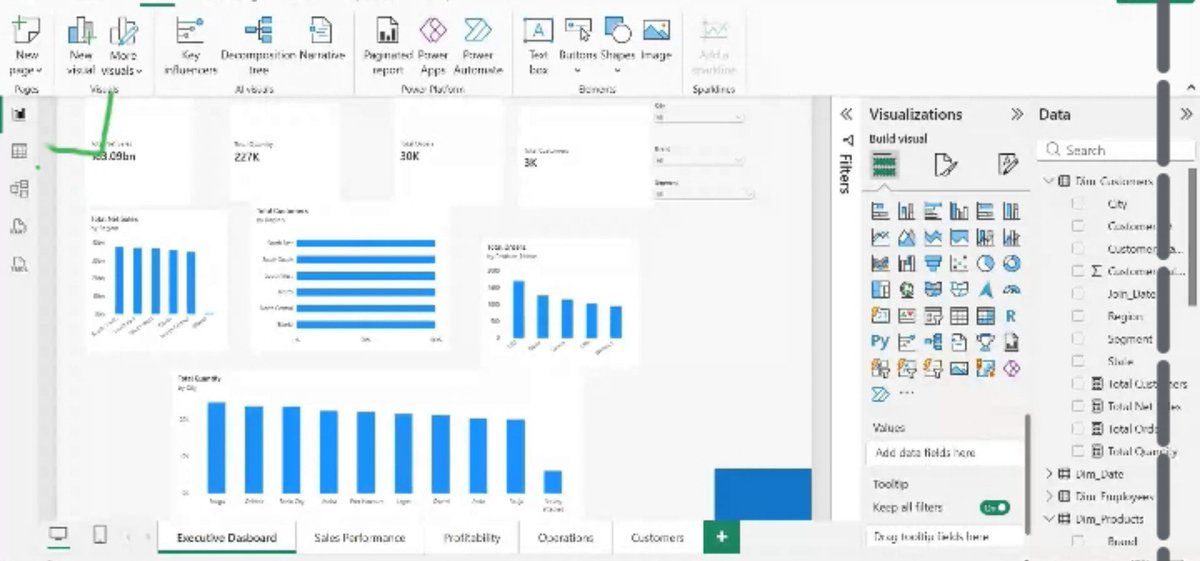
For day 15 @Ifexaacademy we continued building on what we learnt in Day 14, going deeper into how DAX and context can be used to create more dynamic insights in Power BI.
I also learnt more about using proper naming conventions when working with DAX.#DataAnalysis#PowerBI#DAX
Day 14 @Ifexaacademy, I learnt how DAX can be used to turn static insights into dynamic insights in Power BI dashboards.I was introduced to the concept of concatenation using the & symbol. DAX make dashboards responsive to data. #DataAnalysis#PowerBI#WomenInTech#DataAnalyst
Day 13 @Ifexaacademy,I learnt about Row-Level Security (RLS) in Power BI a feature used to control the data different users can access.I learnt how to create security roles and use dynamic RLS to ensure that users only see the information relevant to them. #DataAnalysis#PowerBI
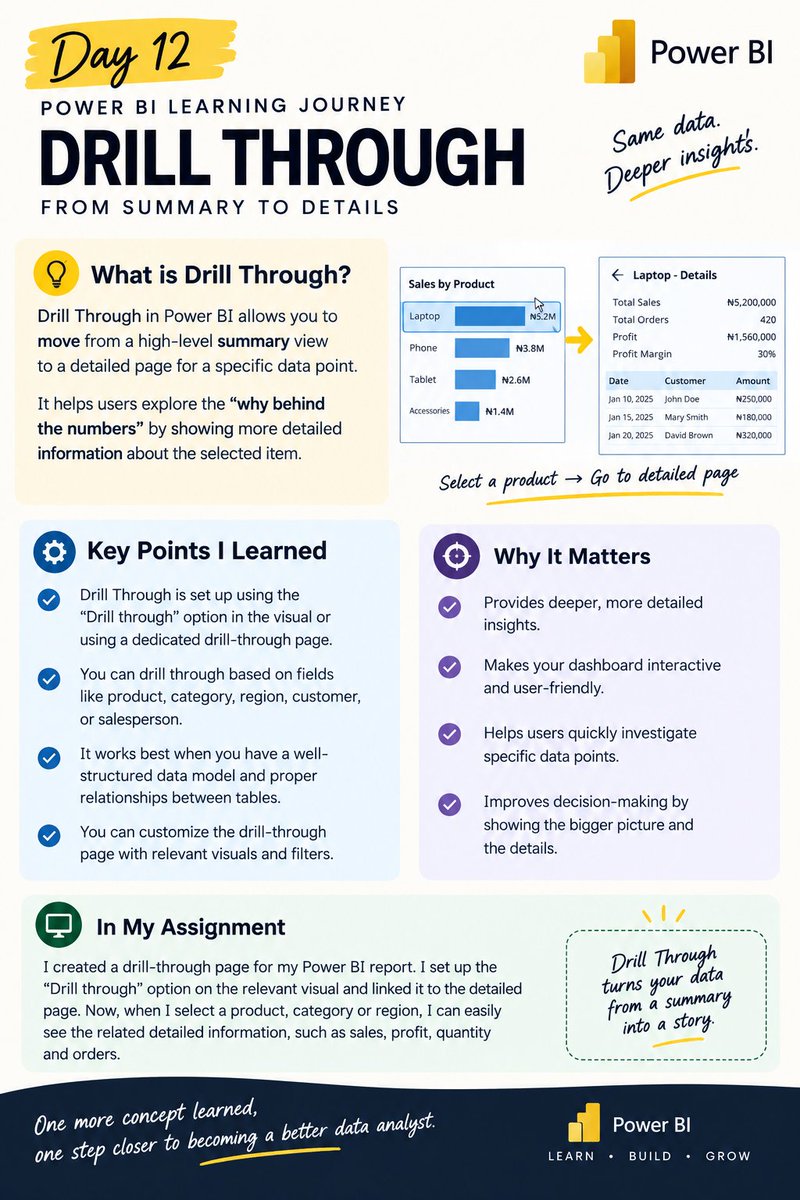
Day 12 @Ifexaacademy , I learnt about Drill Through in Power BI-a feature that allows you to move from a summary view to a detailed page focused on a specific data point.I learnt how it can be used to explore the details behind selected data making dashboards more interactive.
Day 11 @Ifexaacademy was all about making a Power BI dashboard more interactive & user-friendly.I learnt how to:Format dashboards professionally, Create & customize tooltips, Add page navigation using buttons,Connect multiple dashboard pages & Use filters to improve interactivity
Day 10 @Ifexaacademy , we were introduced to DAX(Data Exchange Analysis) which is used to calculate data. To view your results, we use KPIs(Key Performance Indicators)-which are viewed using the visualization panel(contains card, bar chart, etc) Still learning 😊 #WomenInTech
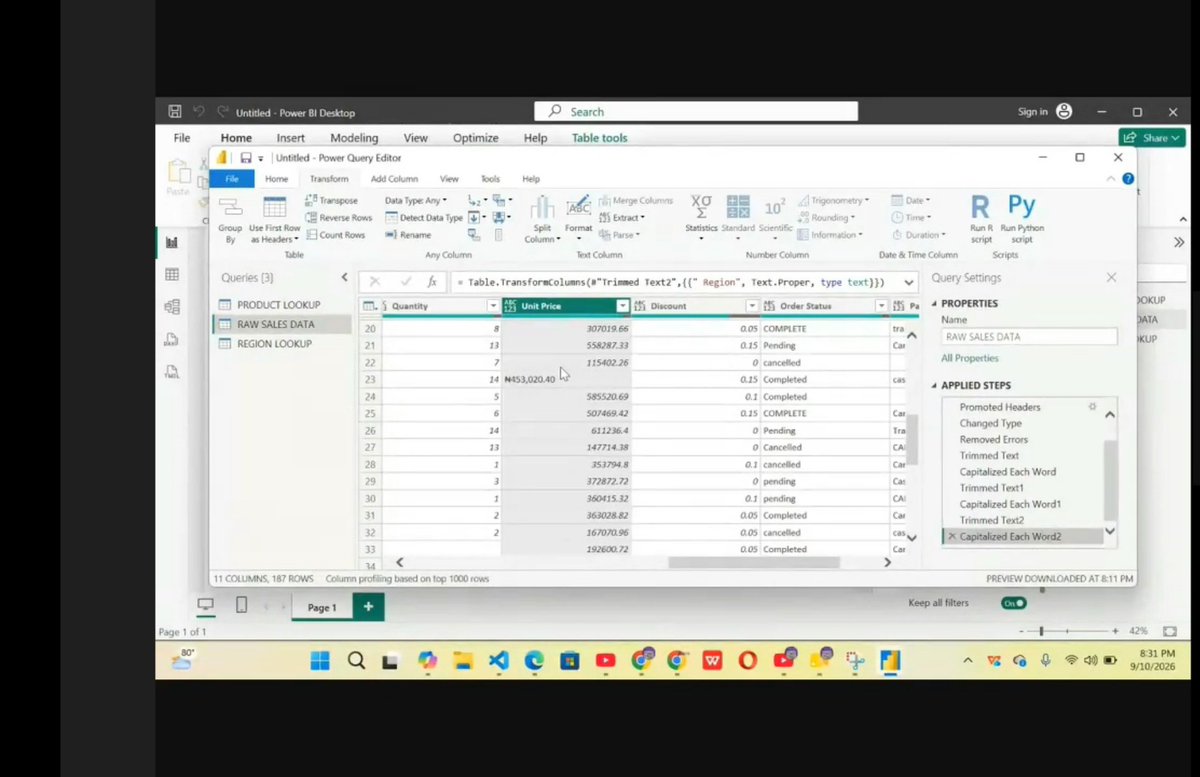
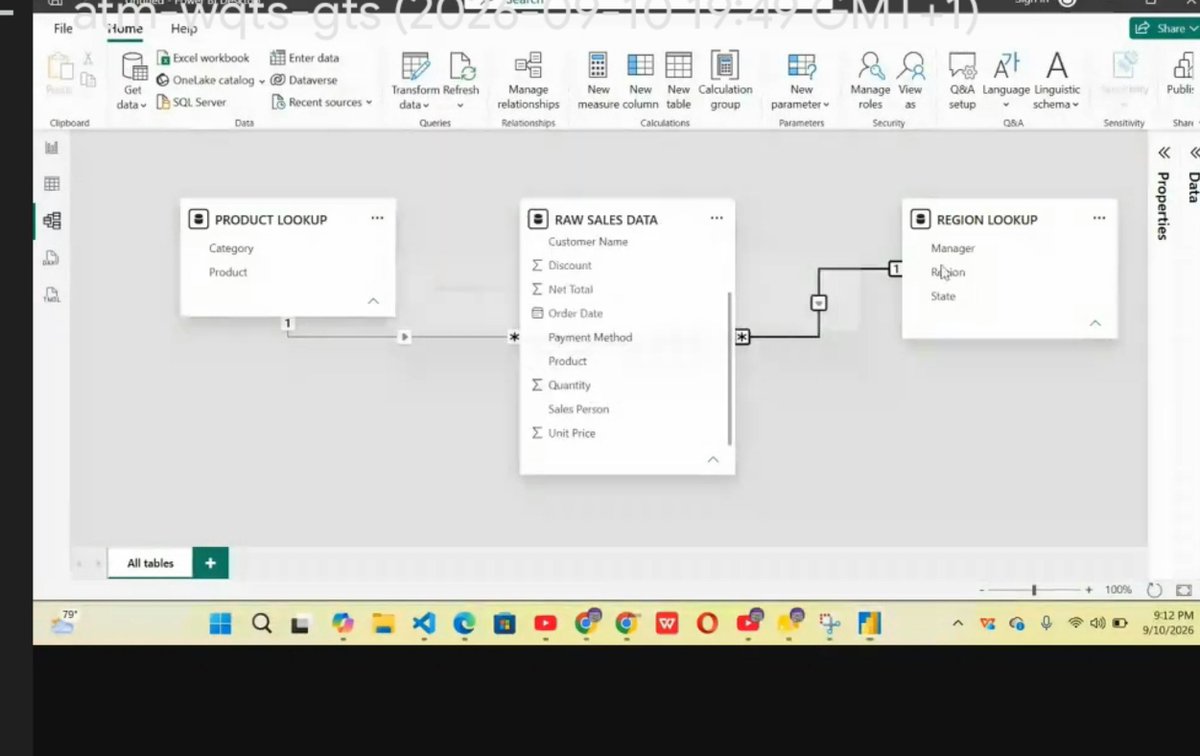
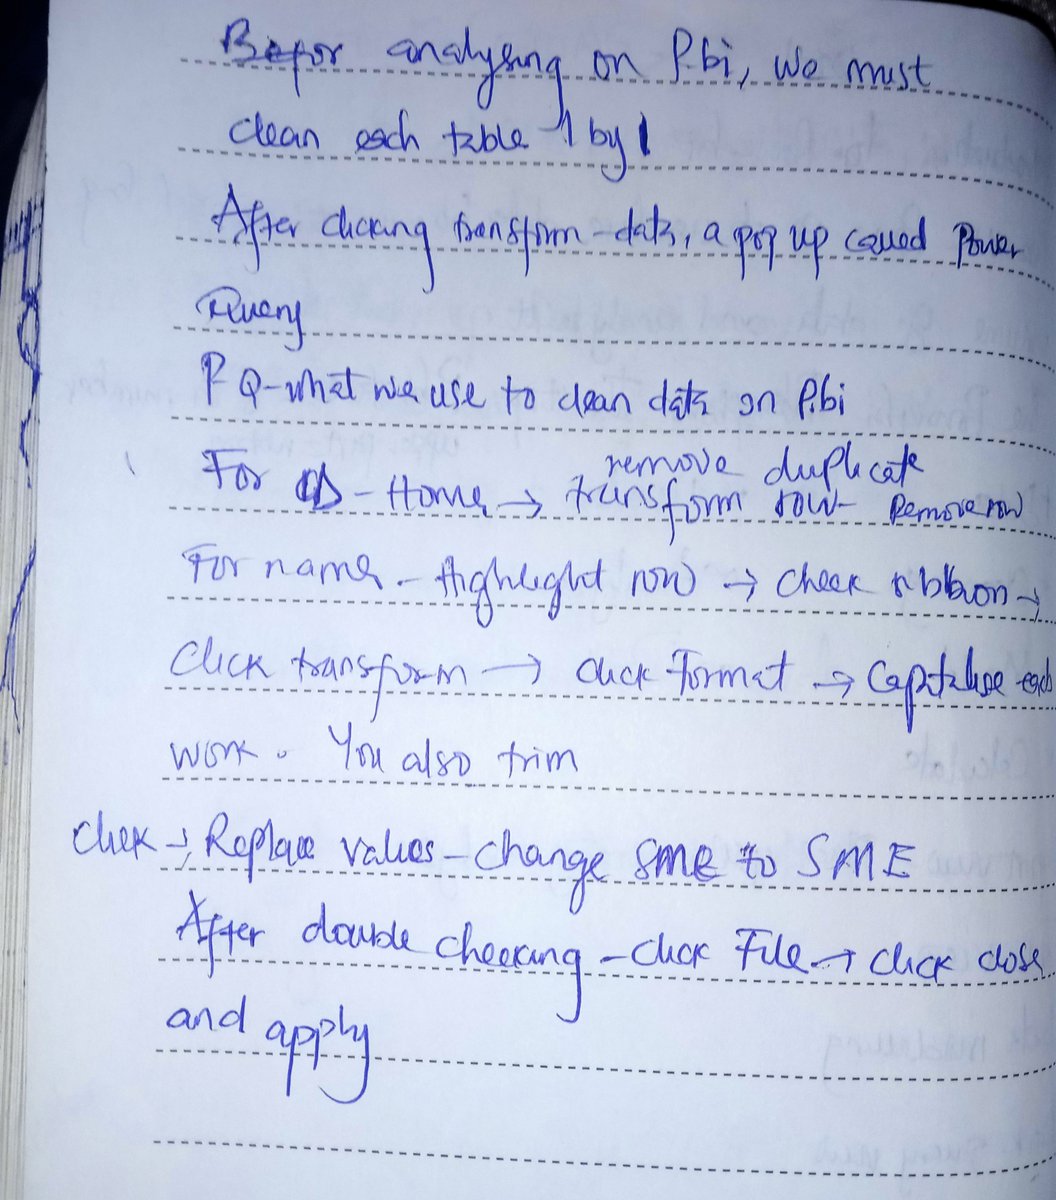
Day 9 @Ifexaacademy , we were introduced to power query- a tool in power bi used for cleaning data. After cleaning, we create relationships between two or more cleaned tables and this is known as data modeling.(3rd step in https://t.co/IkUAupB8Jw workflow). #WomeninTech
For Day 8 @Ifexaacademy , we were introduced to Power BI- a tool useful for working with large volumes of data.The Power BI workflow includes data, cleaning, Model, calculate, visualize, analyze and decide.
Still learning, still evolving. #WomenInTech#DataAnalystJourney
Day 7-Today, we explored Date Functions in Excel and how they can be useful when working with time-based data. Another interesting part of today's class was learning about Kaggle and https://t.co/JjAUPzmha9 as sources for datasets to practice with.
#DataAnalysis#WomenInTech
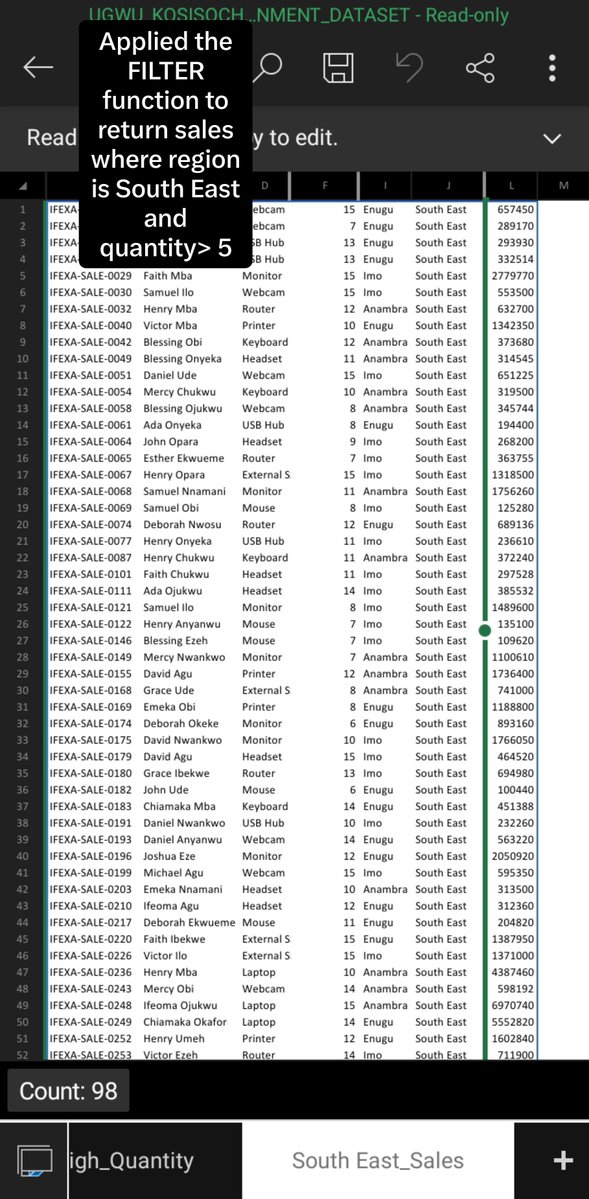
Day 6 @Ifexaacademy I learnt how to FILTER huge datasets based on single & multiple conditions, using the AND(*) logic to get more specific results. We were given an assignment,I worked through the challenge and applied the FILTER function practically. #DataAnalysis#WomenInTech