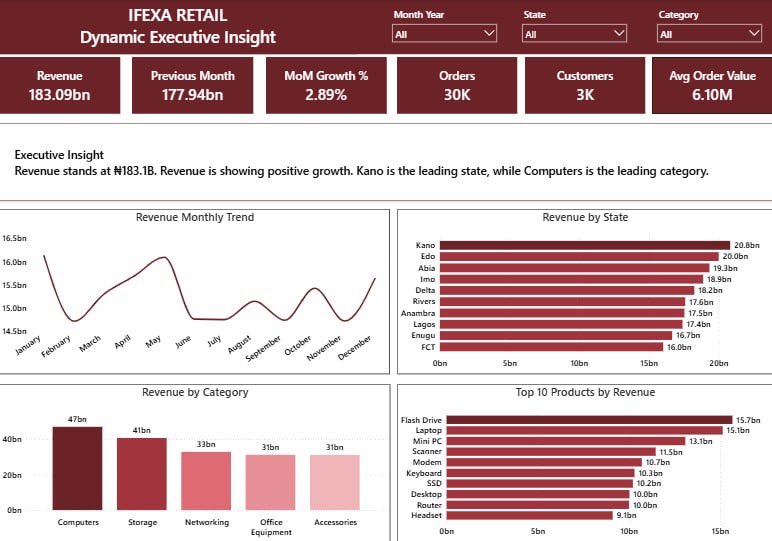
another thing I learnt was Dynamic Executive Insight, and honestly, it was so interesting to see the revenue change based on the filters applied.
I filtered for September 2026, and the revenue came to 5.2B, showing positive growth. 📈
#datafam#POWERBI
Finally completed my first Power BI project! 📊
It took longer than I expected, but I’m glad I stuck with it. I got to put what I’ve learned so far into practice, from data cleaning and transformation to DAX and dashboard development.
I came across this post on August 19 and decided to take the opportunity. On September 1, I enrolled in the IFEXA Academy Data Analysis training with one goal: to learn a practical skill I could actually apply. A few weeks later,
I finished another Power BI project 📊
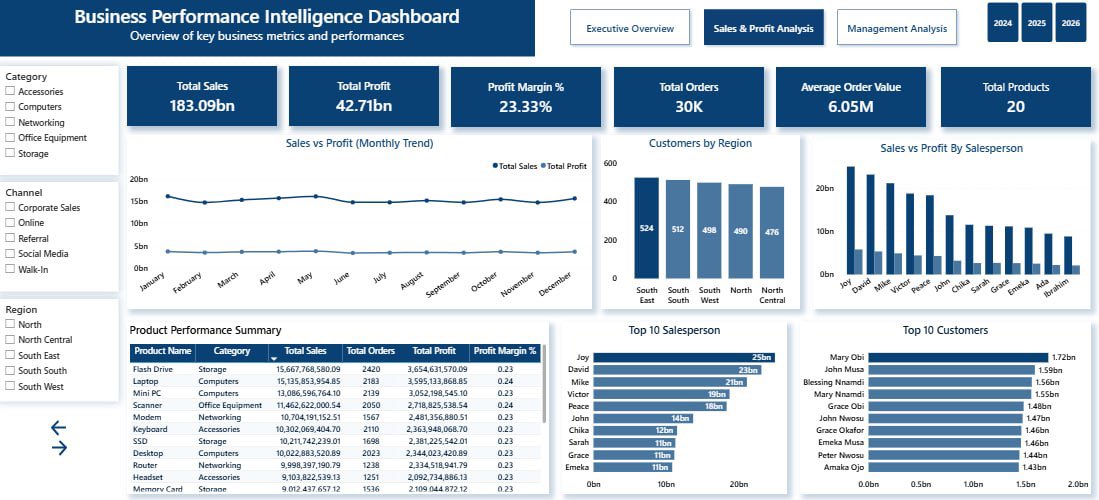
I built a Business Performance Intelligence Dashboard to explore sales, profitability, customers, products, and segment performance.
A few things stood out:
• Computers led revenue
• Retail was the strongest customer segment
++
#datafam
I finished another Power BI project 📊
I built a Business Performance Intelligence Dashboard to explore sales, profitability, customers, products, and segment performance.
A few things stood out:
• Computers led revenue
• Retail was the strongest customer segment
++
#datafam
• January 2025 had the highest sales
• Flash Drive was the top revenue-generating product
• Strong sales didn’t always mean strong profitability
still learning, building, and getting better with every project. 🚀
#PowerBI#DataAnalytics#DataAnalyst#datafam
so far, so good. i can’t wait to finish designing this dashboard.
thanks to @Ifexaacademy@paulifeanyi_G because this challenge is really pushing me out of my comfort zone and making me think harder while solving business questions.
#datafam#powerbi#dashboard
on data modeling.
here, i organized my tables in Power BI and created relationships using common columns. i used many-to-one relationships where needed, helping me connect the data and prepare it for analysis.
#datafam#Excel
currently working with excel functions.
here, i used the FILTER function to analyze the sales dataset based on different conditions. I filtered sales from Anambra, identified orders with quantity greater than 10, filtered South East sales with quantity above 5 +
#datafam#excel
on data cleaning. 📊
i cleaned and standardized the messy data using excel formulas, extracted useful information with text functions, created unique lists, and added quality checks, all without modifying the original dataset.
#datafam#Excel
++found Accessories sales above ₦100,000, and completed the advanced filter using three conditions. I also practiced selecting specific columns from the filtered results.
#excel
i’m using this account to document my data analytics journey.
i’ll be learning, figuring things out, building projects, making mistakes, and hopefully getting better along the way.
do follow and support me. 🫶🏾