#Bitcoin Historical Accumulation Zone
Historically, major #BTC corrections have formed their bottoms around the 100 SMA on the 2-week chart.
Could price go lower? Absolutely.
But trying to sell the exact top and buy the exact bottom is usually a losing game.
The goal is to recognize when long-term opportunities start appearing.
🚨 HERE’S WHY BITCOIN IS NONSTOP DUMPING RIGHT NOW
If you still think $BTC trades like a supply-and-demand asset, you MUST read this carefully.
Because that market no longer exists.
What you’re watching right now is not normal price action.
It’s not “weak hands.”
It’s not sentiment.
And it’s definitely not retail selling.
Most people are completely unaware what’s happening.
And by the time it becomes obvious, the damage is already done.
This move didn’t start today.
It’s been building quietly under the surface for months.
And now it’s accelerating.
Here’s the truth:
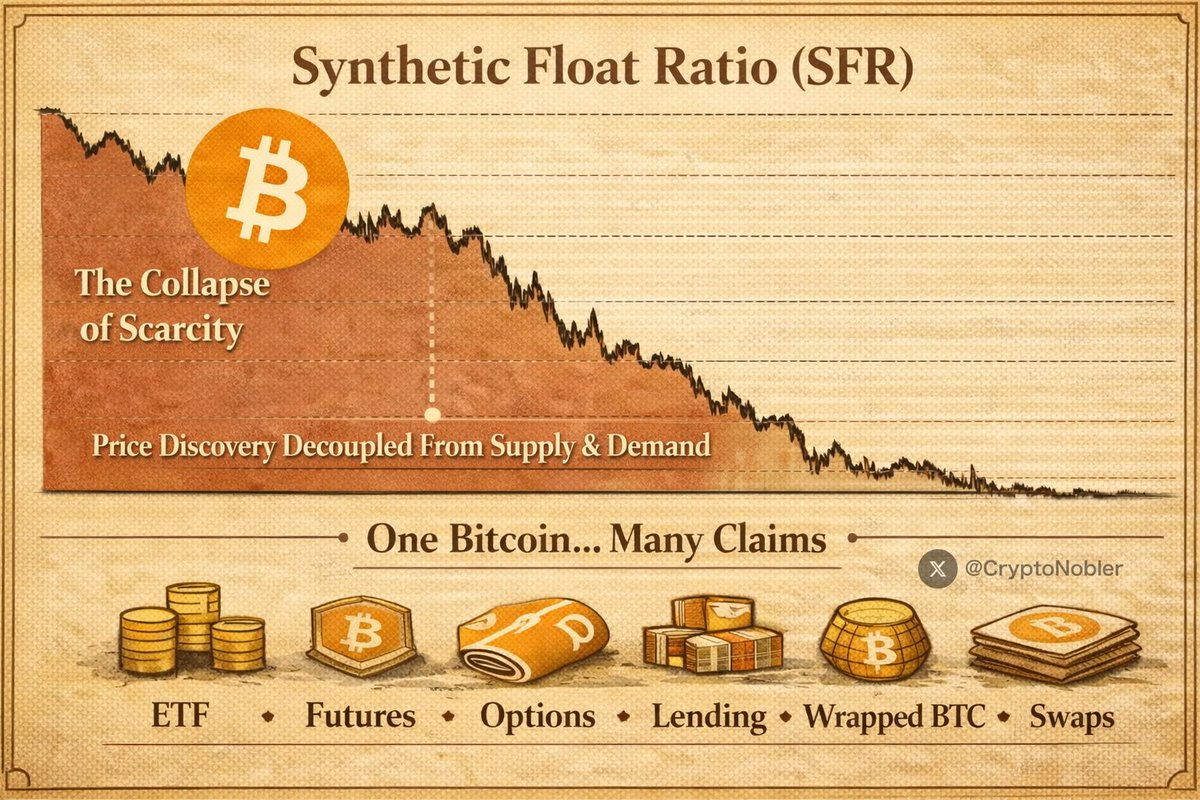
The moment supply can be synthetically created, scarcity is gone.
And when scarcity is gone, price stops being discovered on-chain and starts being set in derivatives.
That is exactly what happened to Bitcoin.
And it’s the same structural break that already happened to:
→ Gold
→ Silver
→ Oil
→ Equities
Once derivatives took over.
The original Bitcoin thesis is broken.
Bitcoin’s valuation was built on two ideas:
→ A hard cap of 21 million
→ No rehypothecation
That framework died the moment Wall Street layered this on top of the chain:
→ Cash-settled futures
→ Perpetual swaps
→ Options
→ ETFs
→ Prime broker lending
→ Wrapped BTC
→ Total return swaps
From that point forward Bitcoin supply became theoretically INFINITE.
Not on-chain.
But in price discovery, which is what actually matters.
Synthetic Float Ratio (SFR).
The metric that explains everything.
Once synthetic supply overwhelms real supply, price no longer responds to demand.
It responds to positioning, hedging, and liquidation flows.
Wall Street can now trade against Bitcoin.
They’re not guessing direction.
They’re doing what they do in every derivatives-dominated market:
1⃣ Create unlimited paper BTC
2⃣ Short into rallies
3⃣ Force liquidations
4⃣ Cover lower
5⃣ Repeat
This isn’t “betting.”
It’s inventory manufacturing.
One real BTC can now simultaneously back:
→ An ETF share
→ A futures contract
→ A perpetual swap
→ An options delta
→ A broker loan
→ A structured note
All at THE SAME TIME.
That’s six claims on one coin.
That is not a free market.
That is a fractional-reserve price system wearing a Bitcoin mask.
Ignore it if you want, but don’t pretend you weren’t warned.
I’ve been calling Bitcoin tops and bottoms for over a decade now, and I’ll do it again in 2026.
Follow and turn on notifications before it's too late.
Here's an early look at what we might expect for Bitcoin cycle low prices from the Golden Ratio Multiplier...
Level 1 sits at $38,800 and has been very consistent for cycle bottoms.
As price declines, this number will drop some.
I also think GRM did an ok/decent job of navigating the cycle top with some intution. Level 5 was the cycle top band for cycle 4, which was hit early in March 2024. This was followed by January 2025, which hit level 4 at 109k.
This is a similar situation to other double tops (2013 and 2021).
It looks like the Halving Cycles Theory has been right after all, completing its first successful cycle after creation.
The Bitcoin cycle top occurring on October 6th, 2025, was within parameters, falling in the 3-month window for the cycle top of October - December in Red Year.
Now that Red Year (the year of the bull market) is over as of November 28th, 2025, the cycle is over, and a new one begins.
Starting with the Orange Year, the year of the bear market, which is set to last until November 28th, 2026.
No matter how hard people have fought the cycle, and still do, it remains right on track.
I remain out of all of my positions in crypto, with no plans to reenter any time soon.
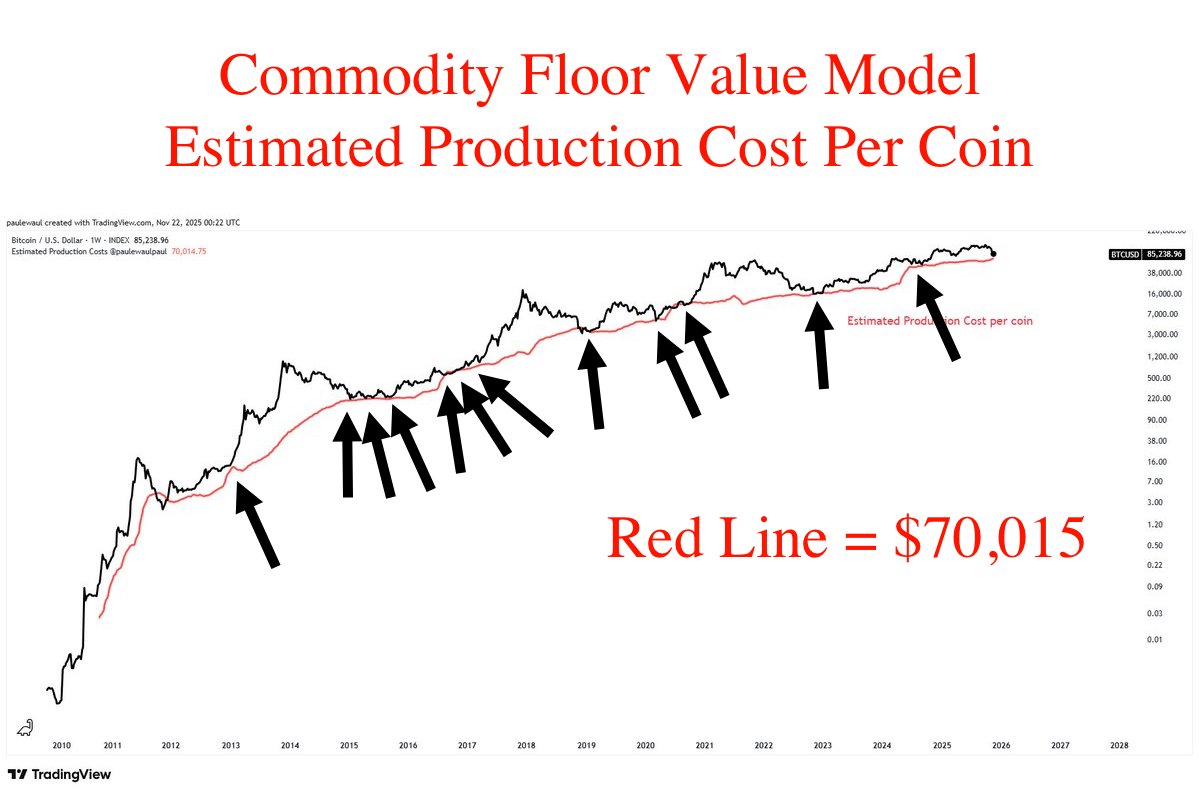
One of the most important Bitcoin charts you have most likely never seen.
Notice how many times Bitcoin has found support at this estimated cost of production red line.
The line currently sits at $70,000.
This is not just on-chain data—this is a cost of production model for Bitcoin, which is a commodity, and commodities almost never trade below their cost of production.
Shout out to (@)paulewaulpaul for creating this chart.
Make sure you give him a follow—he does unique and great work.
The price of any commodity tends to gravitate toward the production cost. If the price is below cost, then production slows down. … At the same time, the increased production … pushes the cost of generating towards the price.
Satoshi Nakamoto - Feb 21, 2010
#Bitcoin
Here's what I see happening on 4 year cycles —
Common view: people believe in 4 year cycles, and that 2026 will thus be a down year for BTC.
First order effect: people thus sell in 2025 to avoid the down market year.
Second order effect: the 2025 sellers cause 2025 to be a down year, thus breaking the 4 year cycles.
Third order effect: 2026 is open season. 4 year cycles broken.
(BTC is current at +2.5% YTD 2025)
$BTC Bitcoin Has Officially Lost the 50W MA for the 4th Time in History
Even though Bitcoin has broken down, it’s now much closer to a bottom than a top. I’m expecting a bottom soon, likely near the CME gap
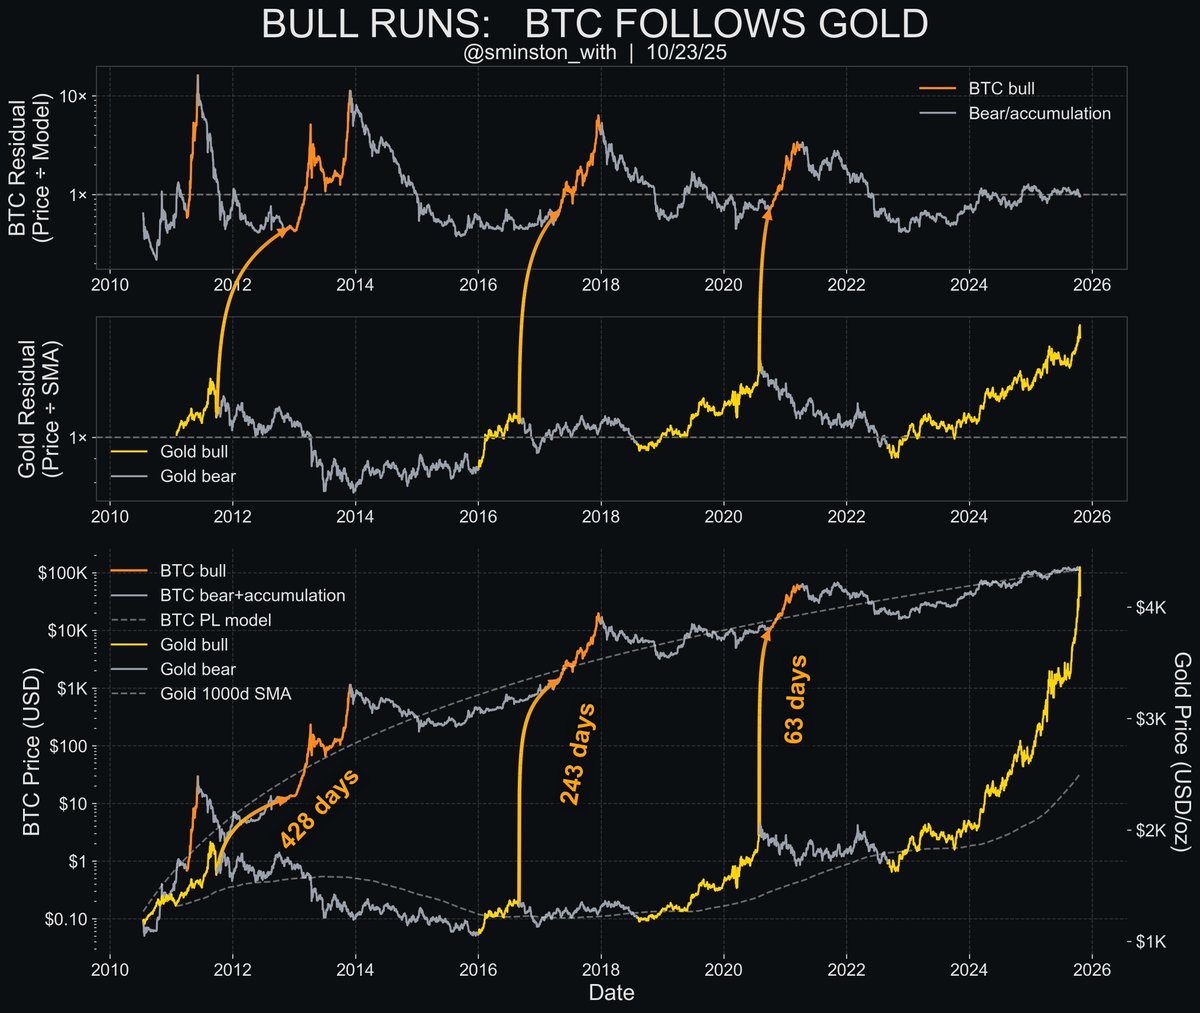
You're gonna have fun with this one; best to bookmark it and sit with it a bit.
- - -
👉BTC FOLLOWS GOLD 👈
🏃♂️🏃♂️🏃♂️
Top two plots are residual plots based on the price plot underneath, for both Bitcoin and Gold - lets you visualize the fluctuations of both assets becoming more over- or under-valued.
The curved arrows connect the ENDS of the gold bull runs to the BEGINNINGS of the Bitcoin bull runs - along with the approximate lag of BTC behind gold runs in days.
Now look where we are now with gold.
🪙⏩🧡