LIVE NOW: The Rise of Local Stablecoins in Africa Report 2025
A deep dive into Africa’s evolving stablecoin landscape - from payments to RWA tokenization.
Built by @IntelliSages - Africa’s Blockchain Data & Intelligence Hub.
🔗 Read the full report: https://t.co/m8vfMNATI6
INJ rallied ~90% in 30 days, rising from $3.05 in mid-April to a peak of $5.80 on May 13.
The May 7 native USDC launch produced only a minimal same-day price reaction ($3.83 --> $3.85), sustained rally occurred in the following week as markets digested the combined effect.
$LINK's combined daily trading volume peaked on December 3, 2024, at ~$12.16B. Since the start of 2026, $LINK monthly trading volume ranges between $8.5B–$13.5B. As of early May 2026, the month-to-date trading volume stands at $3.8B.
Read full report: https://t.co/VdFYgBwjkB
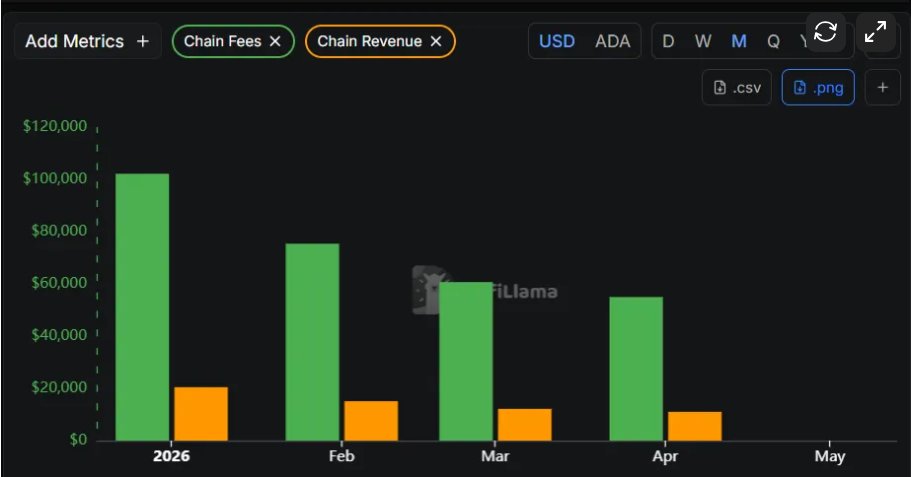
Cardano generated $238K in total chain fees in Q1 2026.
Fees have declined every single month:
Jan: $102,318
Feb: $75,494 (-26.2%)
Mar: $60,776 (-19.5%)
Last 30d: $49,690 (-37.5% vs Q1 avg)
And has a price-to-revenue ratio of 99,500x.
Read full report: https://t.co/DFeyz51wUB
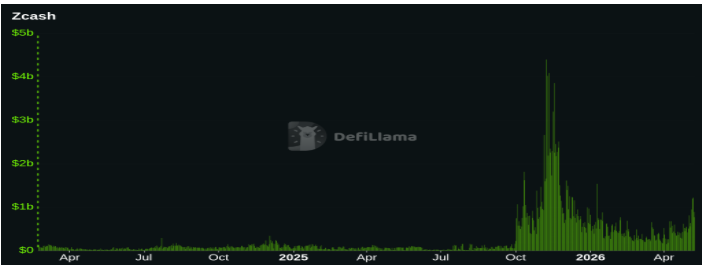
As of May 2026, ZEC records ~$803 million in 24-hour trading volume across ~67 exchanges and 113 trading market
Between Oct–Nov 2025, marked the most significant liquidity event in years, with daily volumes exceeding $2.5 billion at peak
Read full report: https://t.co/ZByXuYvLql
We dug into $ZEC, the shielded pool numbers are hard to ignore.
As of May 2026, ~5M ZEC (~30% of circulating supply) sits in shielded addresses; this a new all-time high.
At the start of 2024, it was ~8% up.
Now there is a 4x increase in over two years, entirely organic.
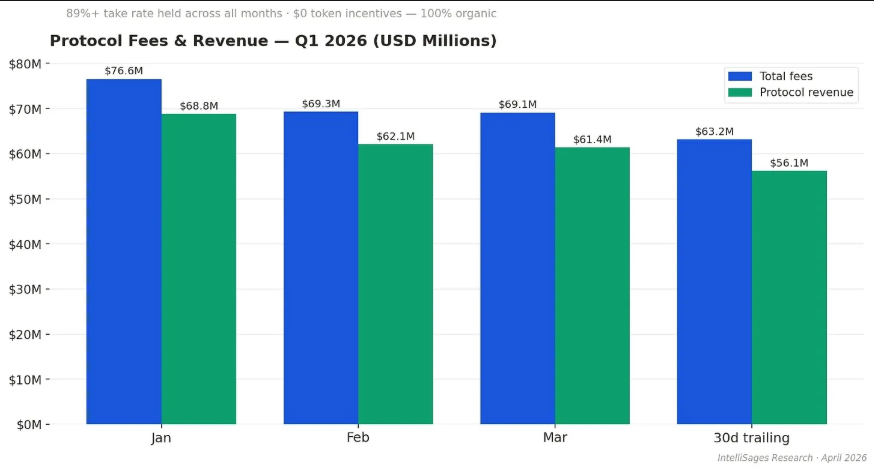
In January 2026, HYPE generated $65M in a single month, ranking above Ethereum and Solana in daily fee revenue that period
97–99% of those fees flow into an Assistance Fund that automatically buys HYPE from the open market
Read full report: https://t.co/pw28j5GL1v
Hyperliquid's average daily active traders grew from 39,566 in January to 50,785 in March, a consistent +13% month-over-month through Q1 2026 with $0 in token incentives. The platform crossed 1 million cumulative traders in February
Read full report: https://t.co/t7yIZzk4yo
Hyperliquid ($HYPE) generates ~$670M/year in real revenue, returns 97–99% of fees to buy back tokens, has zero VC allocations, and controls ~75% of on-chain perp volume
It trades at 14.9x P/S, which is cheaper than most high-growth stocks
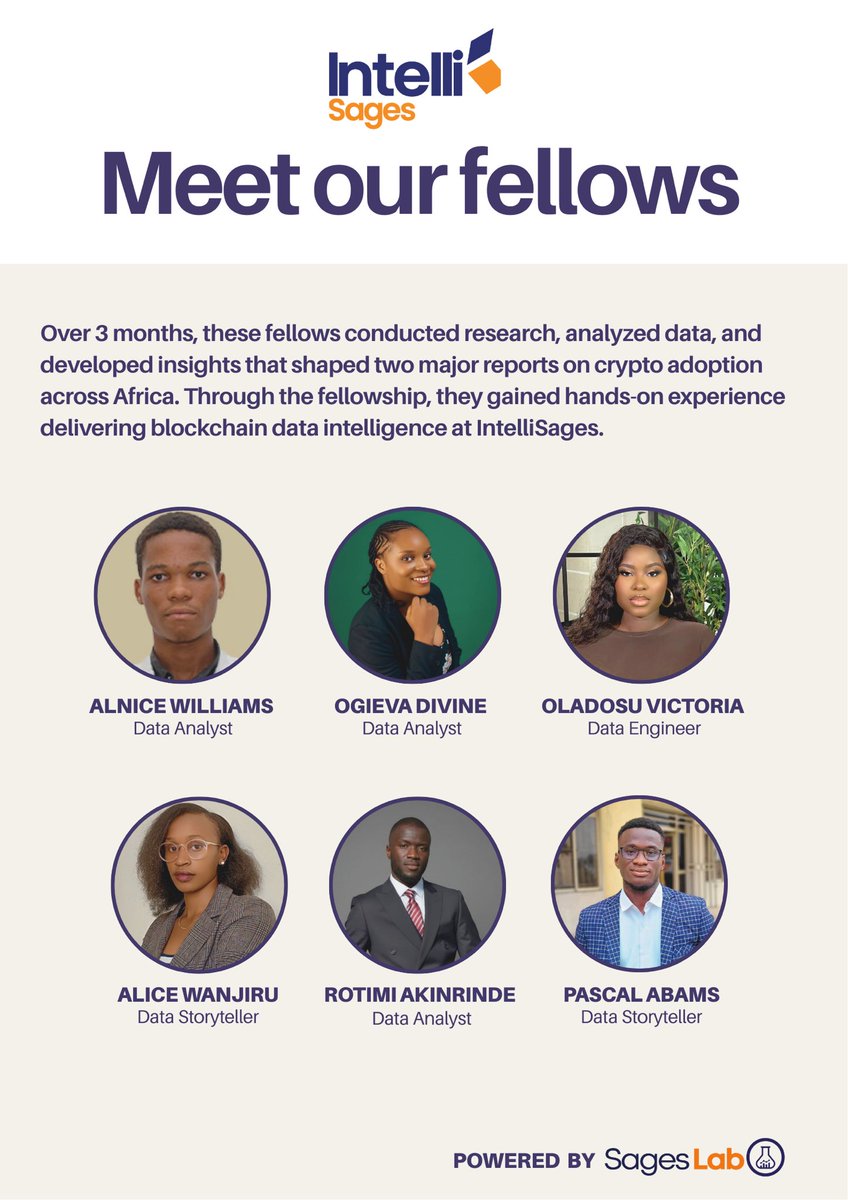
We are proud to spotlight the IntelliSages Fellows - a cohort of data professionals who transformed learning into real-world impact.
Over the past 3 months, these fellows conducted research, performed data analysis, and developed insights that contributed to two major reports
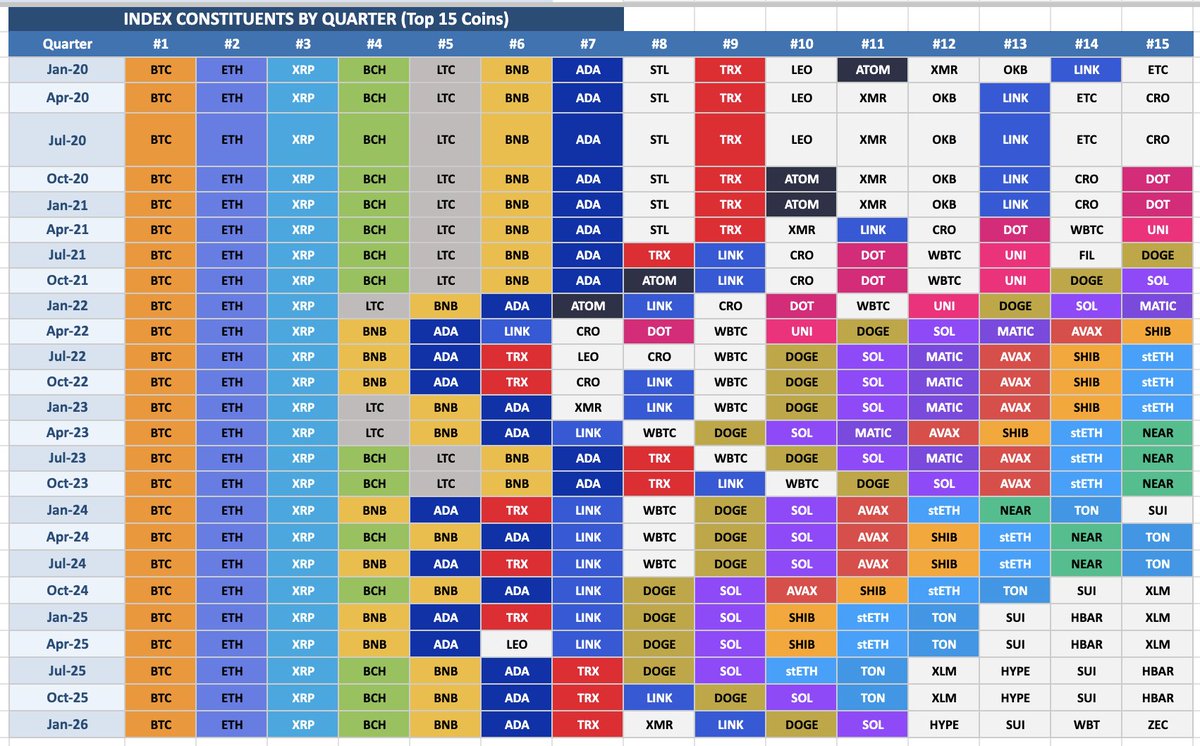
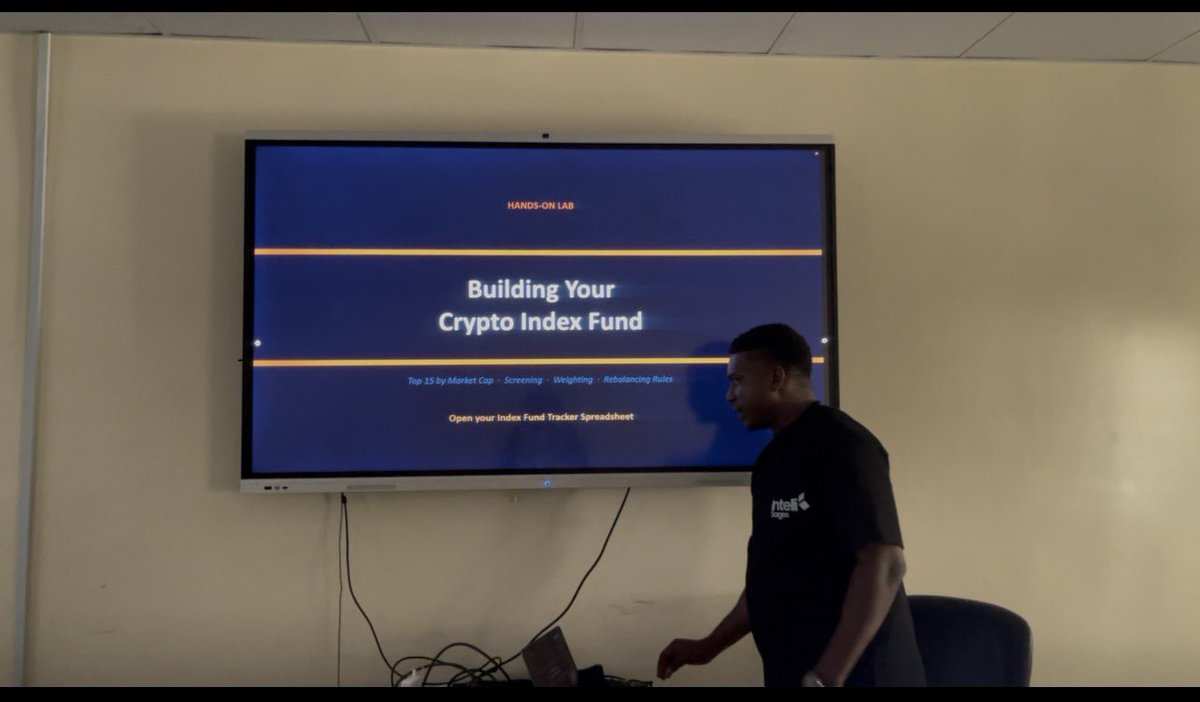
As part of our ongoing training programme for @MeristemNigeria's alternative investment analysts, we recently built and back-tested a Top 15 Crypto Index and the results sparked some genuinely interesting conversations about digital assets as an investable asset class.
Here's what we did.
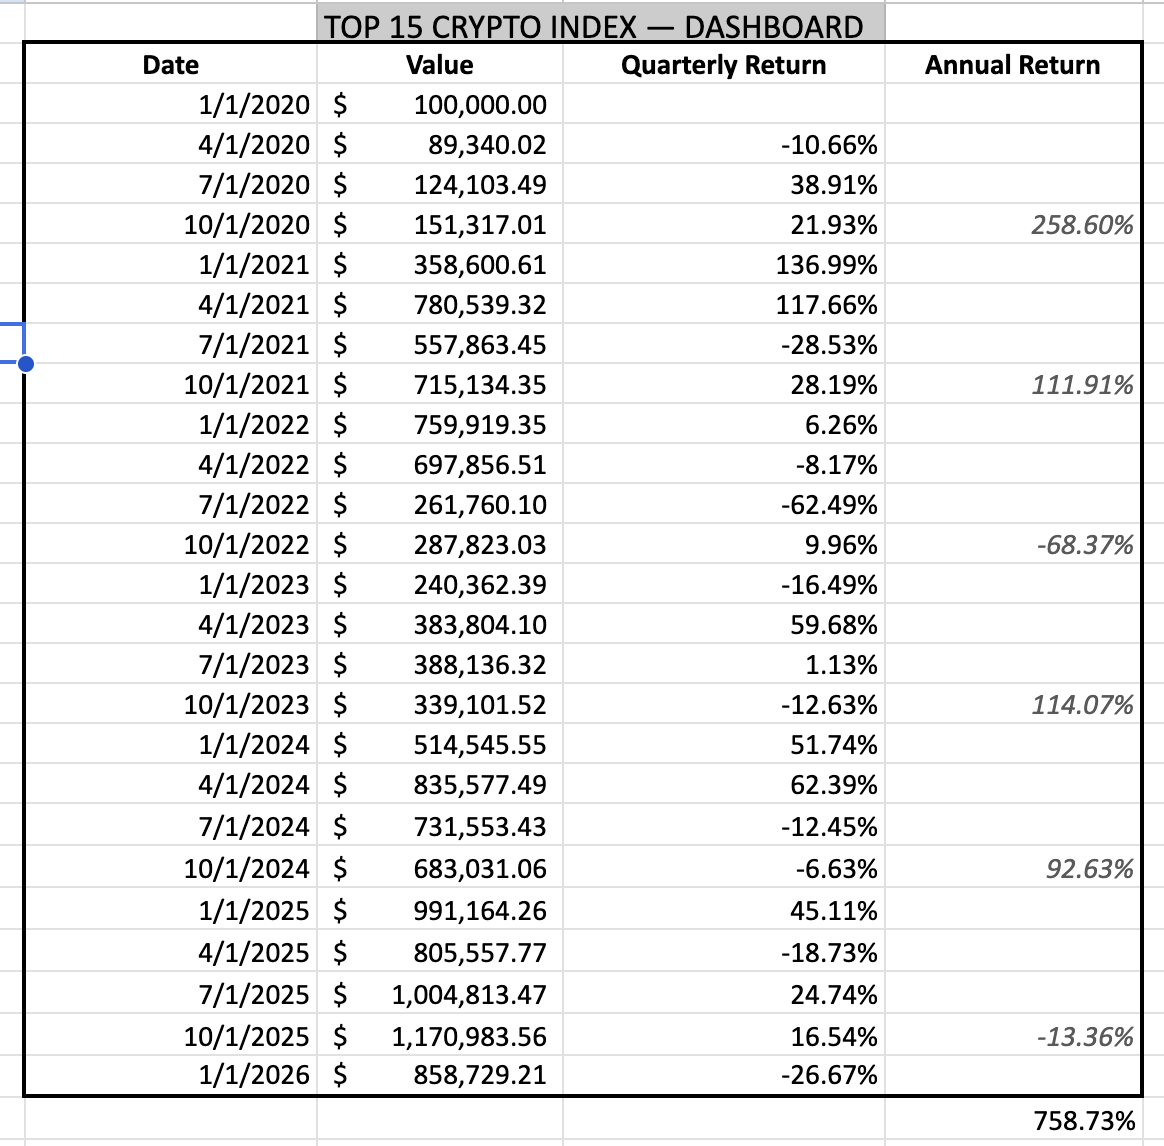
We constructed a rules-based, market-cap weighted index of the 15 largest cryptocurrencies, rebalanced quarterly. The idea was to simulate what a disciplined, institutional-grade approach to crypto exposure would have looked like using the same logic you'd apply to a traditional equity index.
We back-tested it from January 2020 to end of 2025, starting with a hypothetical $100,000 portfolio.
The back-test returned +758.7% over that period.
Not from making active bets or timing the market but from following a consistent, rules-based process through one of the most volatile periods in financial markets, including the 2022 crypto winter where the index dropped 68.4%.
Two design choices defined the methodology:
→ Quarterly rebalancing. The top 15 coins by market cap are identified fresh every January, April, July, and October. The portfolio is fully rebuilt each quarter based on current prices and rankings - no legacy positions, no drift.
→ A dynamic universe. The composition changed meaningfully over time. In 2020, the index was dominated by BTC, ETH, XRP, and BCH. By 2025, SOL, AVAX, TON, SUI, and HYPE had entered reflecting how rapidly the digital asset landscape evolves. A static portfolio would have missed that entire structural shift.
One of the most revealing findings: Bitcoin's raw market-cap weight ranged between 44% and 77% across the back-test period. That level of concentration is something any institution building a real allocation would need to think carefully about and it's exactly the kind of insight this training exercise was designed to surface.
The exercise helped our analysts think more rigorously about digital assets: how to define a universe, how to build a systematic rebalancing framework, and how to interpret performance through multiple market cycles.
But beyond the training value, it raised a broader question that we think more traditional institutions should be sitting with:
If you were to build a structured, transparent, rules-based exposure to digital assets - what would it look like? And what would it have returned?
For institutions that have been watching the crypto space from the sidelines, the back-test data suggests the asset class rewards discipline as much as conviction.
We'd love to hear how other investment professionals are approaching this conversation. Drop a comment or reach out directly.
#DigitalAssets #CryptoInvesting #InstitutionalInvesting #AlternativeInvestments #CryptoIndex #PortfolioManagement #Meristem #AnalystTraining
Over the next two weeks, we will be working closely with their team to explore institutional frameworks for digital asset research and investing covering
- Crypto Valuation Models
- Crypto Investment Fund Structures
- On-chain Analytics
- DeFi yield strategies
- etc
We are excited to announce that IntelliSages has begun a Digital Asset Investment Training Program with the Alternative Investment Team at @MeristemNigeria
Over the next two weeks, we will be working closely with their team to explore institutional frameworks for digital asset research and investing covering
- Crypto valuation models
- Crypto Investment Fund Structures
- On-chain Analytics
- DeFi yield strategies
Etc
Sub-Saharan Africa pays the world's highest remittance costs, ~9% avg vs the 3% UN target.
On $1,000 sent home, nearly $90 vanishes in fees.
That's why stablecoins now make up ~43% of crypto volume in SSA.
See full report ; https://t.co/fp7FenqyLC
Across several African economies, inflation remains elevated. In markets like Nigeria and Egypt, double-digit inflation and 20–40% parallel FX premiums distort access to dollars.
When local currencies lose purchasing power, financial decisions shift from growth to survival.
If you'd want to be a part of the next IntelliSages Fellowship, start your journey with AnalyticsSages and we'll be in touch with you.
Powered by @SagesLab#SagesLab#IntelliSages
At IntelliSages we're committed to accelerating crypto adoption through data intelligence, training and collaboration. These Fellows have been instrumental to this mission.
Congratulations Fellows
@Timi_blaize@deevhyno@willsbills@passieintel@vhictoirya@eveshiey