A small change to this account.
For years, this X account has been focused almost entirely on Elliott Wave and FX under EWStrategy.
EW Strategy isn’t going anywhere. It will continue as before but I’m simply taking this X account in a more personal and broader direction.
I’ll still share Elliott Wave and FX here, but you’ll also see more stocks, momentum setups, trades, ideas, and eventually some of my own journey as a trader.
So, a new name for this account:
StopFirst.
Why?
Before I enter a trade, I want to know where I’m wrong.
Stop first. Entry second.
Same person. More markets. More of the process.
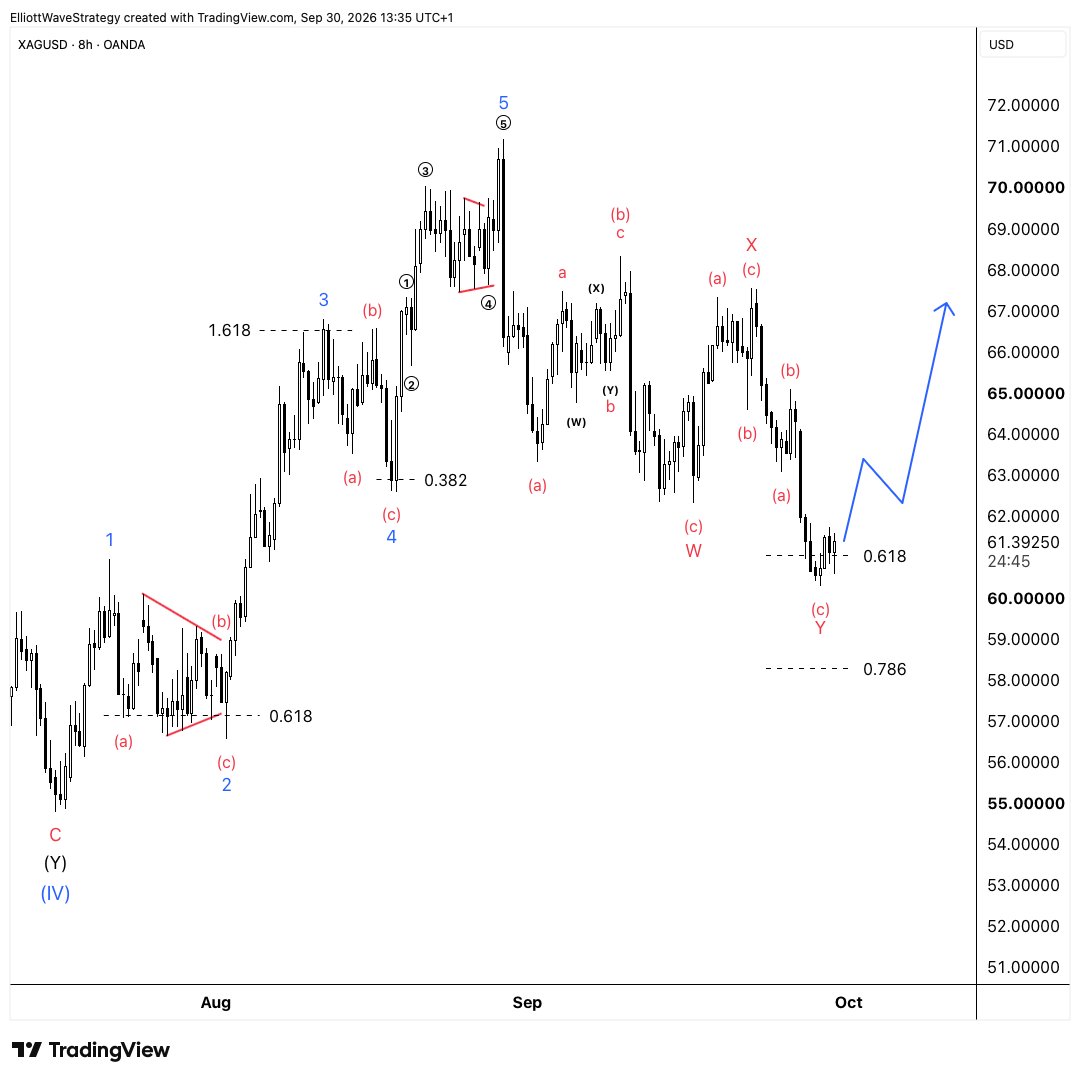
#XAGUSD
Silver has reached the 61.8% retracement, and I think this W-X-Y correction may be ending!
To confirm new trend we need to see first minor impulse and minor correction!
Timing is everything. We trade with a plan, not in a hurry!
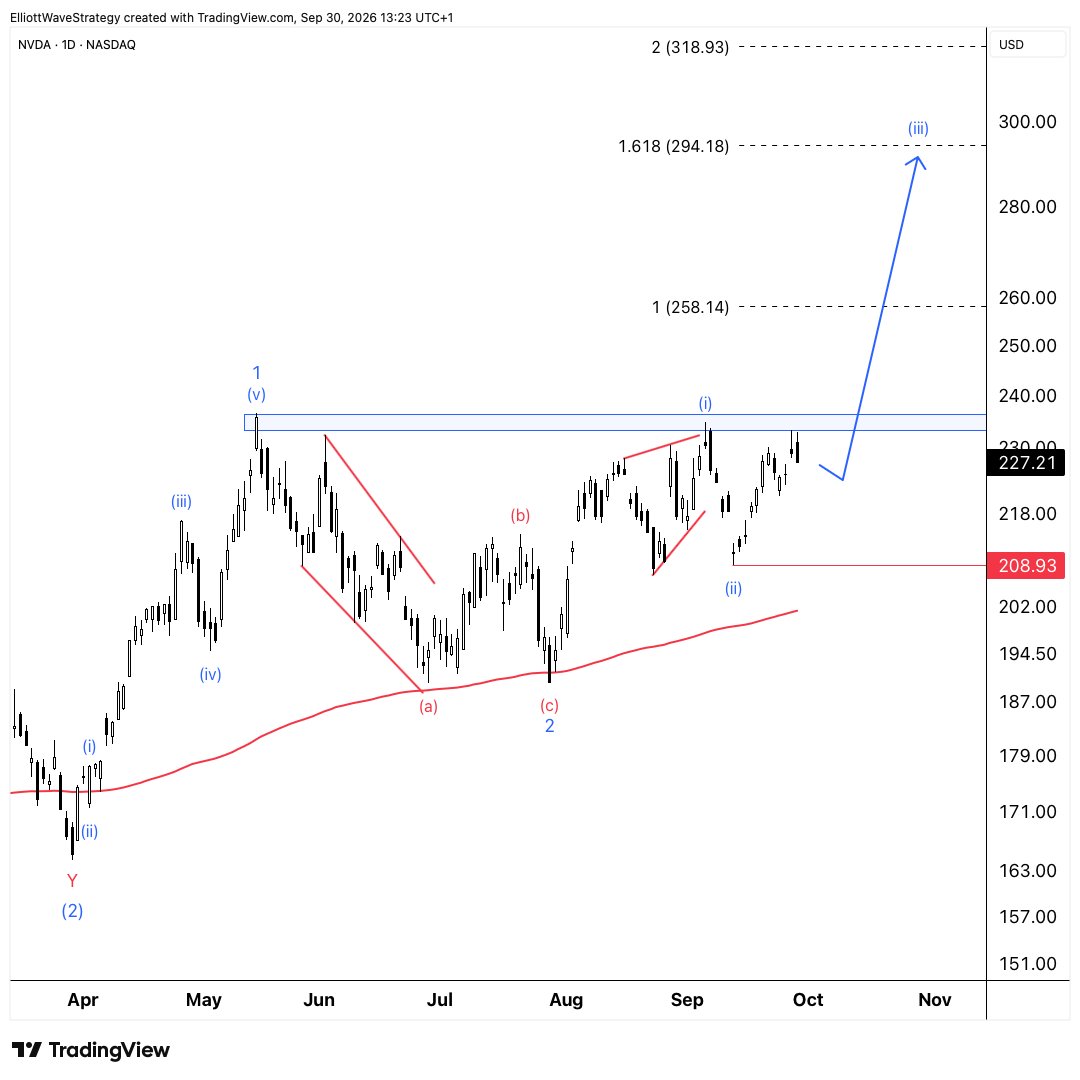
$NVDA - Wave 1 topped in May, wave 2 finished on the 200-day average in August, and wave 3 has been building since then: (i) into early September, (ii) finished mid-month.
The May and September highs sit in the same zone near 235. Clear that and I'd expect wave (iii) to accelerate toward the 1.618 extension near 294.
Where I'm wrong: a break below the mid-September low.
Same setup on $GOOG as April: falling trendline off the highs, price just above the 200 day. That break ran about 45%.
This time the base is bigger and the line comes in near 350. Another dip into the 200 day wouldn't bother me. What I'm watching for is a daily close above the line. If it goes, the measured move from the spring rally points into the 450s.
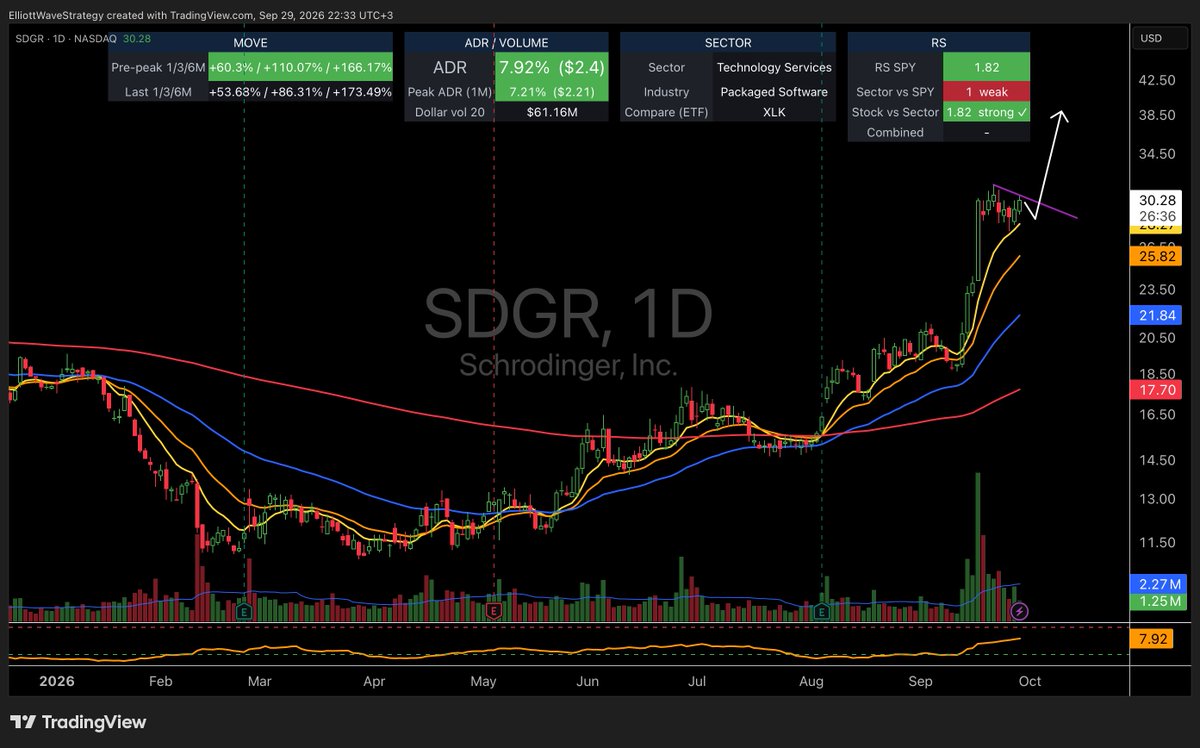
$SDGR is on my watchlist.
Big move off the August base, up about 110% in 2 months. Since then it's been resting in a tight flag just under the highs, with volume drying up and price staying above the 10- and 20-day moving averages.
Quiet in the base. Looking for volume next.
@MarketsManners That fits with yields easing a bit today. If real money keeps absorbing the selloff, the gap may close with yields coming down rather than stocks. Some of that long is probably duration replacement, but the size still says a lot.
The 10-year bond yield is above 5.2%, and Nasdaq futures remain in positive territory.
Despite interest rates being at this level, stocks are proving more resilient than I expected. When there is such a divergence between bond yields and stocks, one of them usually gives way eventually.
@TheLongInvest Bullish on the bigger picture too. Short term, still there's an one last drop risk. A break above the 200 EMA and the purple trendline would be very positive.
@Mr_Derivatives Good bounce. I'm not sure the pullback on $QQQ is done yet, but every count I have still resolves higher. Above the June high, I'd stop worrying about the dip.
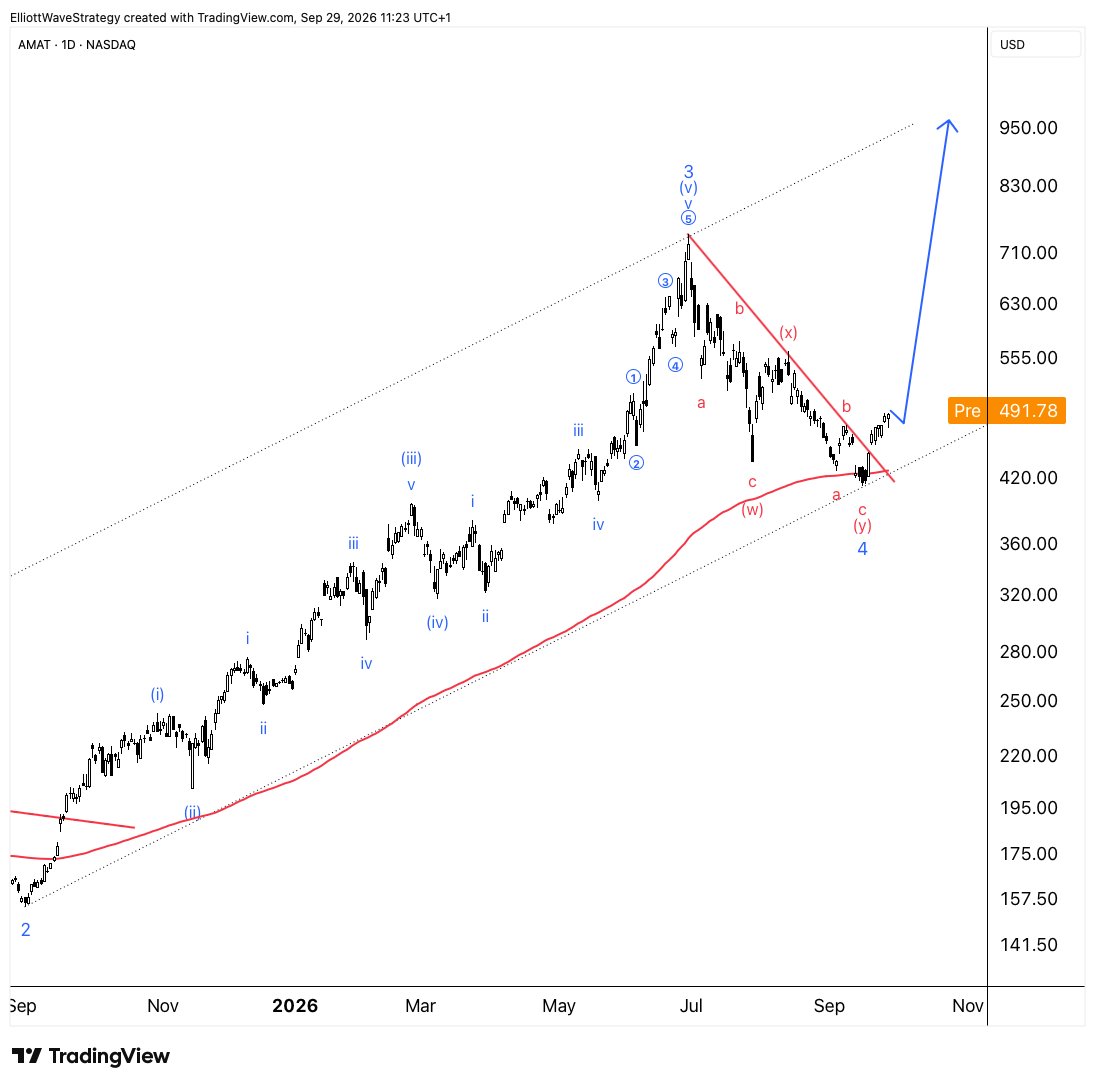
$AMAT bounced off the 200-day EMA again.
I think the drop from $730 to $412 completed wave 4 as a double zigzag. It ended near the lower channel line, and price has now broken the falling trendline.
I'm looking for wave 5 next. The 2–4 channel projects into the $900s, though even a return to $730 would be a big move.
Where I'm wrong: a break back below $411.51.
$DXY: more upside first?
I’m still waiting for bearish confirmation. A break above resistance would invalidate my near-term bearish count. If that zone acts as support, I’d look for a rise towards the 50–61.8% Fib area.
I’m prepared for either path.
#DXY 🇺🇸
The dollar had more room to rise than I expected. I’m still looking for a turn lower, but the RSI is worth watching here 👀
Price has pushed higher without the same strength in RSI. That divergence is a warning. A break of the RSI uptrend would give us more evidence.
Below 101, I expect the decline to pick up speed. Above 101.8, my bearish count is invalid and the rally can continue. We’re not below 101 yet!
#XAUUSD
These two counts read the structure differently, but both pointed lower. An alternative count doesn’t always mean the opposite direction.
Here, both leave room for more downside. If gold reaches that marked area, the reaction there will be worth a closer look.
This is something I always check when reviewing alternatives. Another valid count might challenge my view, or it might support the same direction for a different reason.
@ignilr Rare, but it happens. Frost & Prechter treat the triangle position as a guideline, not a hard rule, and note a wave 2 can take that form on rare occasions. You could also count it as W-X-Y. Either way the bigger expectation doesn't change.
@JPalicska Rare, but it happens. Frost & Prechter treat the triangle position as a guideline, not a hard rule, and note a wave 2 can take that form on rare occasions. You could also count it as W-X-Y. Either way the bigger expectation doesn't change.
@TechCharts I lean lower short term as well. Where I differ is the bigger picture. I still read the whole move down from the September high as a correction inside the uptrend, so even below 4,200 I'd expect a deeper pullback, not a trend change.
https://t.co/bdHCKGNuwU
#XAUUSD
These two counts read the structure differently, but both pointed lower. An alternative count doesn’t always mean the opposite direction.
Here, both leave room for more downside. If gold reaches that marked area, the reaction there will be worth a closer look.
This is something I always check when reviewing alternatives. Another valid count might challenge my view, or it might support the same direction for a different reason.
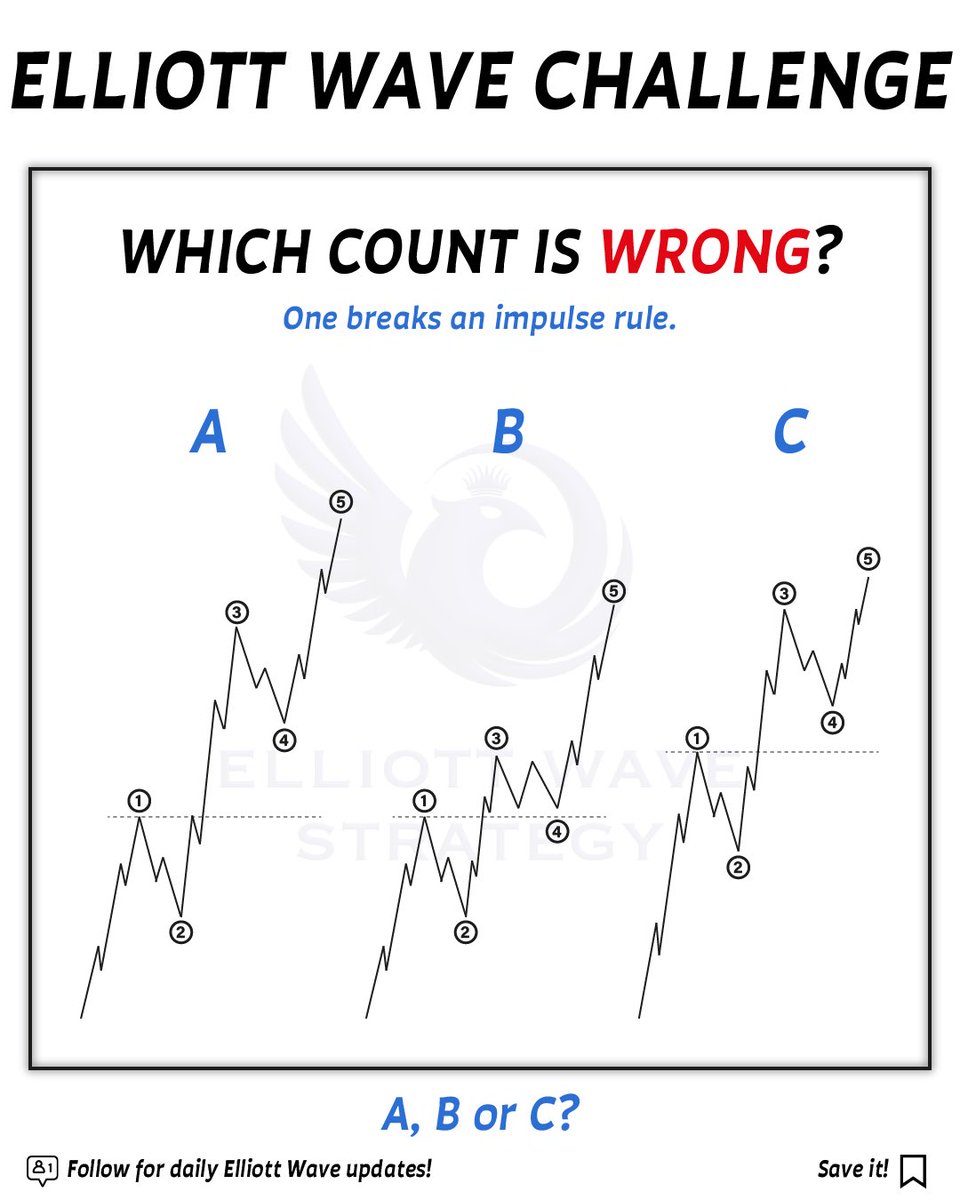
They all move higher. They all have five labelled waves. But one count breaks an Elliott Wave impulse rule 👀
Which one: A, B or C?
Look closely at waves 1, 3 and 5. Compare their price moves, not the time they take.
Leave your answer below and tell us which rule it breaks. Let’s see who spots it.
#forextrading #trading #ElliottWave #TechnicalAnalysis
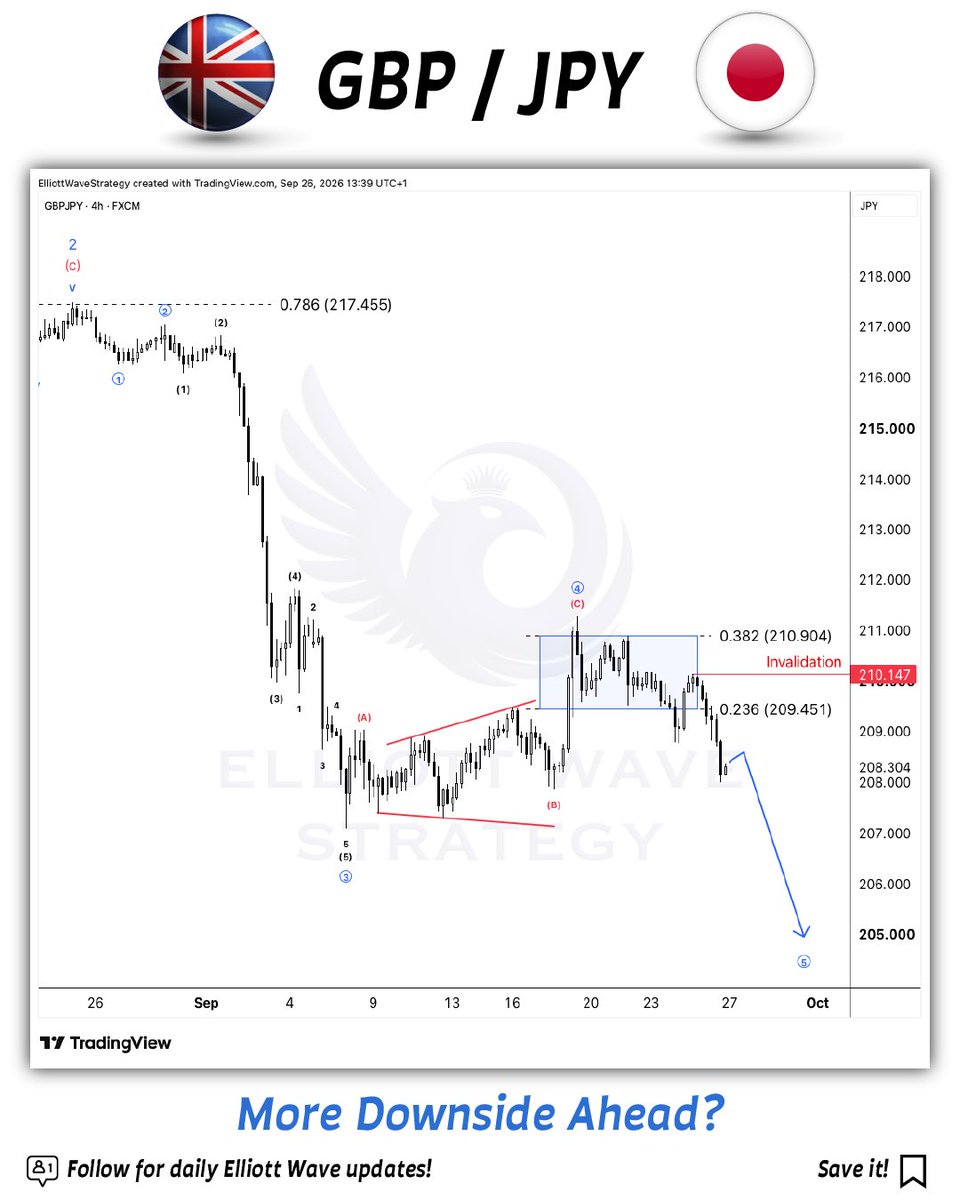
#GBPJPY
That correction kept us waiting a little… but Friday got things moving :)
In Wednesday’s update, I was looking for another decline towards 207.45 and 205.00. Price has now reached 208.00 and closed the week near 208.30.
We’re getting closer to the first target. A small bounce could come first, then I’m still expecting another move lower. Above 210.147, I’d need to revise this short-term count.
#ElliottWave
#GBPJPY 🇬🇧🇯🇵
📍 Remember the correction from our last update? It took a little longer this time :)
Price pushed slightly above our zone and is now coming back down. I still expect another move lower, towards 207.45 and 205.00.
🎯 This is why I update my charts every day. Corrections don’t always finish the way we first expect!
There’s the pullback we were waiting for 👀
Nasdaq came into the marked area and is already moving higher again. In our last update, we talked about these smaller corrections inside a strong trend. Now you can see one on the chart.
I’m looking for another push towards the upper channel line. First, let’s see Nasdaq get through the previous high.
#nasdaq #us100 #elliottwave
#NAS100 🇺🇸
Nasdaq passed 30,500. We expected a small pullback first, but the move was stronger than expected.
In a strong trend, small corrections can end quickly. Then price keeps moving higher.
We’re watching 29,950–30,220 for wave (4), followed by another rise towards 30,900.
After these five waves, we expect a bigger correction in wave ②. Our broader view is still up, so that correction will be important for the next stage.
That’s what makes this chart interesting. There may be more room to rise, but we don’t need to chase every move. We have a plan for the next correction and we’ll follow it as the chart develops.