Revisiting power plants by looking at the distribution in France. Almost forgot that number of plants ≠ power generated. 😅
Southern France: sunny
Northern: windy
Southern/eastern: rivers
Should really map point size to generated power but ran into #rayshader limitations. :P
🔥 Finally!
Just launched the R color palette finder 🚀
🎨 Explore 2500+ palettes, see them in action, get the ggplot2 code.
➡️ https://t.co/ry2FLy0KMT
🙏 @joseph_barbier and @Emil_Hvitfeldt for the paletteer package!
Useful? Bug? Feature request? Let me know!
NASA's Black Marble is the most accurate source of nightlights data.
However, it's difficult to use.
Here are the exact steps you need to take to work with Black Marble data:
Legendary @TsukamotoHideki minted 3 artworks of my “Point Of Entry” drop. Just wow thanks so much for the extraordinary support fam!! 🔥😳
One more signed poster in the way - congrats on #3, #4 & #5 🎨
25 left! I’m feeling a sold-out soon 💎
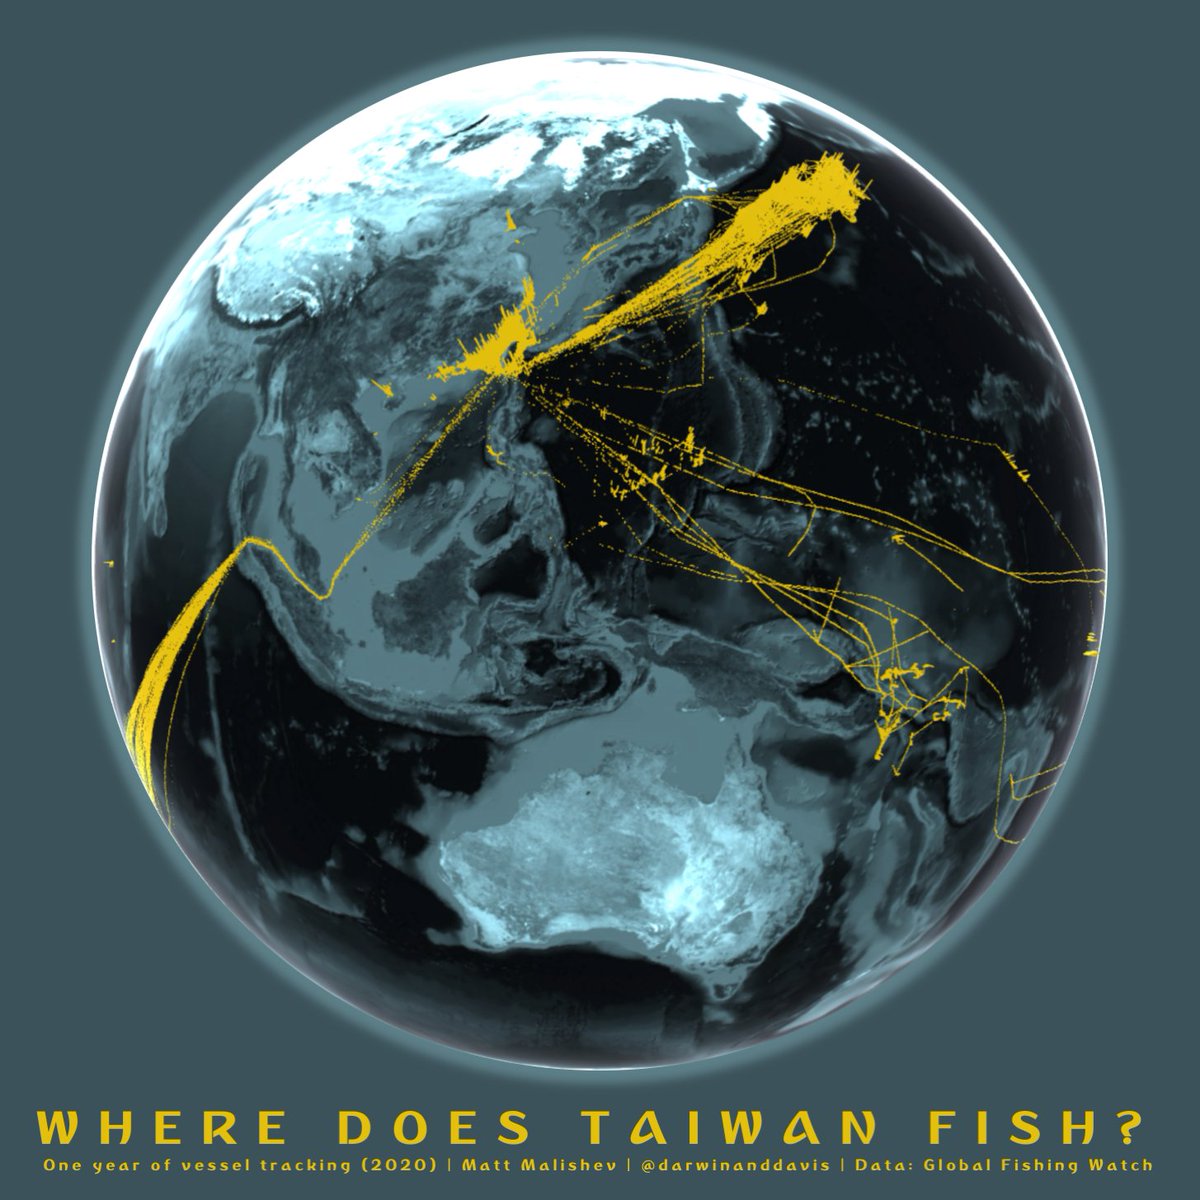
#30DayMapChallenge 2023 - Sharing all #R code, so like/follow and reach out w/ q's
Day 6 - Asia
Where does Taiwan fish? Integrating d3 and #rstats to test interactive globe textures w/ density data #rspatial
R code ⬇️
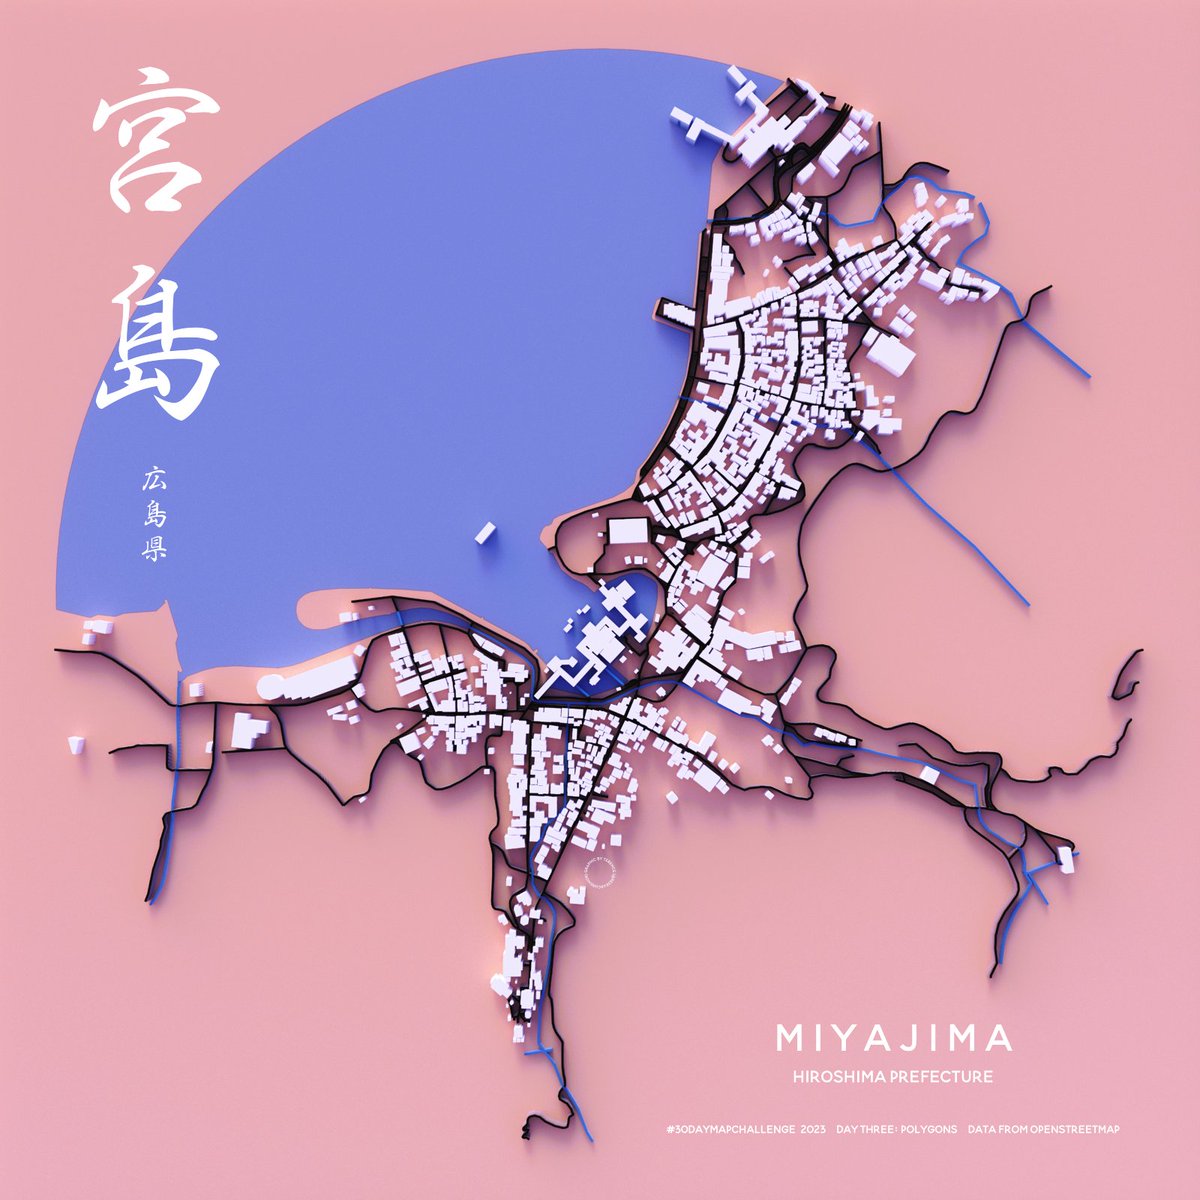
Meant to share this last night for another contribution to #30DayMapChallenge, Day 3 Polygons but passed out—a building map of Miyajima, Hiroshima Prefecture, Japan. I love how we can see Itsukushima Jinja, which was closed for restoration when I visited last year.


![mathladyhazel's tweet photo. This minimal math posters are great. [https://t.co/5nBcqbVamR] https://t.co/z64ehN2UAS](https://pbs.twimg.com/media/GO2cFxTWcAELEKq.jpg)
![mathladyhazel's tweet photo. This minimal math posters are great. [https://t.co/5nBcqbVamR] https://t.co/z64ehN2UAS](https://pbs.twimg.com/media/GO2cFxSWUAAJDTq.jpg)
![mathladyhazel's tweet photo. This minimal math posters are great. [https://t.co/5nBcqbVamR] https://t.co/z64ehN2UAS](https://pbs.twimg.com/media/GO2cFxSWAAAcdyT.jpg)


![mathladyhazel's tweet photo. This minimal math posters are great. [https://t.co/5nBcqbVamR] https://t.co/z64ehN2UAS](https://pbs.twimg.com/media/GO2cFxVWIAAJO_Z.jpg)