Bloomberg says higher energy prices helped. The quarterly split says otherwise.
Q1 net: RMB 17.74bn. H1 net: RMB 25.63bn. So Q2 ≈ RMB 7.9bn — down 56% q/q, in a quarter when Brent was higher than Q1.
Volumes fell 5.6%. Upstream output was flat. The entire beat was Q1 inventory revaluation, and it reversed.
A refiner's profit rising into a crude spike is an accounting event, not an earnings event.
China’s biggest oil refiner saw its first-half profit rise 12% from a year ago, as a surge in global energy prices benefited upstream revenues even as it squeezed fuel sales. https://t.co/hTi47mXlbD
Our "tech" book currently holds almost nothing anyone would call tech.
Not a call on BABA or YMTC — position sizes barely moved. What changed is what the book is willing to hold. Ex-ante net vol went from ~20% to single digits while notional exposure stayed up.
The model didn't forecast an HK$80bn placement. It just stopped paying for vol.
Chinese technology stocks came under renewed pressure on Monday, reflecting supply concerns over the fundraising plans of Alibaba and Yangtze Memory https://t.co/14rNyY3M8T
Context for non-China readers: "flexible employment" was a statistical instrument before it was a labour-economics category. Universities have pushed graduating students to sign 灵活就业 forms for years so they don't register as unemployed. The anger isn't at a professor. It's at a word people already knew was doing accounting work.
The term ‘flexible employment’ has gone viral in China after a prominent economics professor described gig work as a form of ‘welfare,’ drawing widespread public anger and highlighting deep anxieties over job insecurity https://t.co/T60uPTXO0x
@aleabitoreddit Market already answered you. Brent -1.4%, WTI -1.6% into the presser. The "toughest ever" rhetoric got priced two weeks ago when it added 5%. Sell-the-news was set up before the op-ed went live.
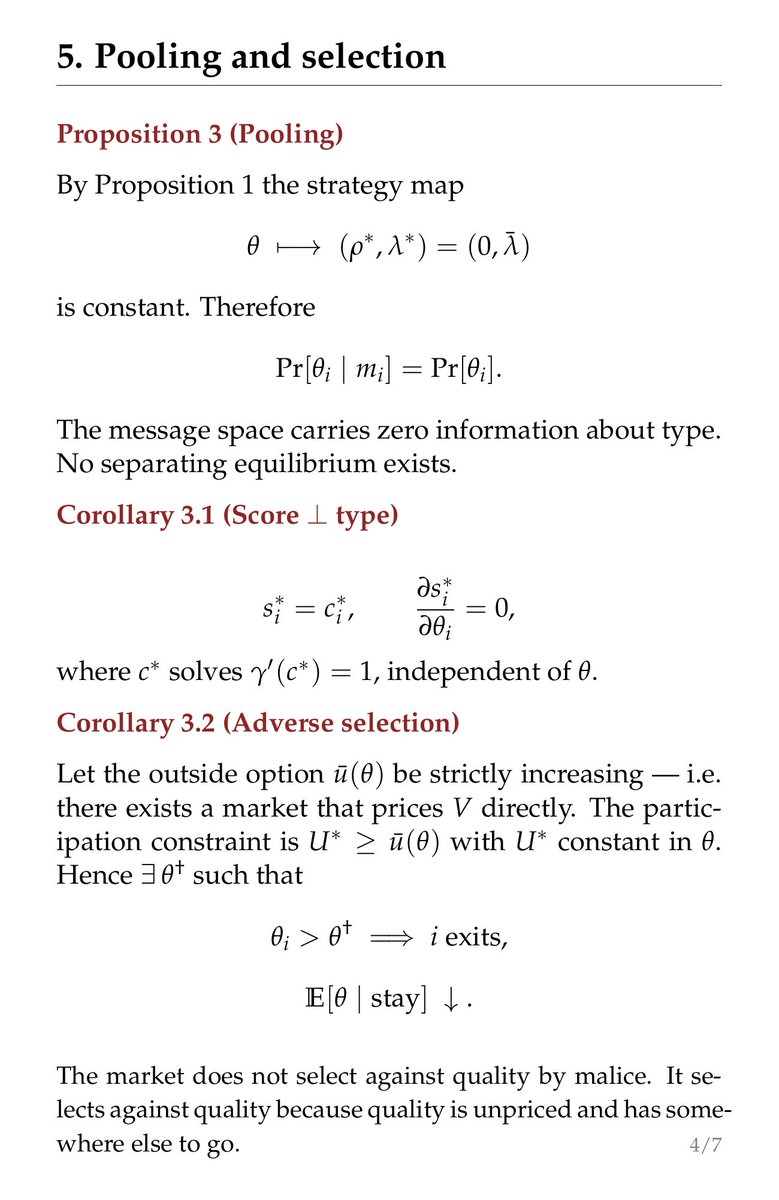
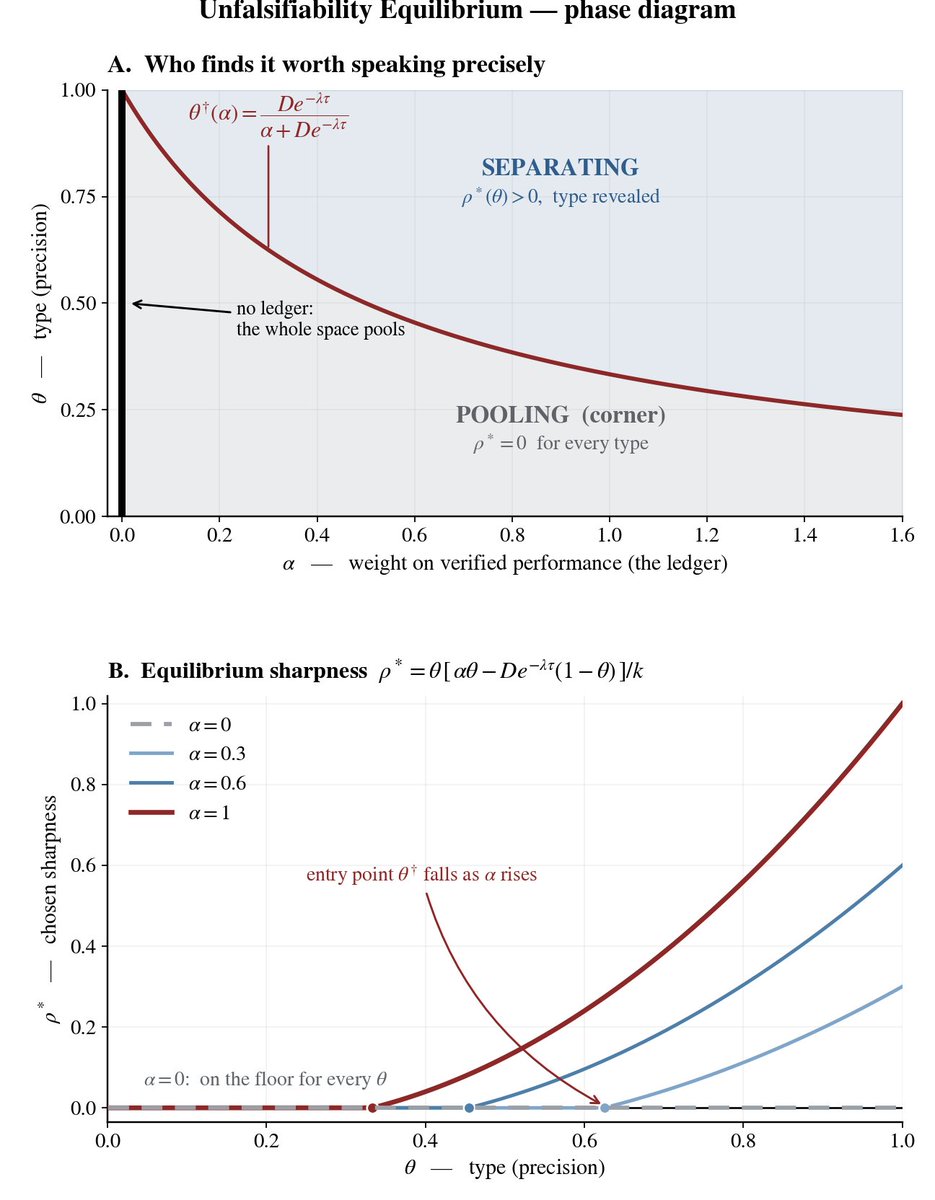
Coming out of a meeting this morning, I figured something out. If a system doesn't score based on net asset value curves, it will inevitably drift toward the exact same destination: everyone speaking in unfalsifiable statements. This isn't a moral issue; it's a mathematical one.
For a statement to be proven wrong, two conditions must be met simultaneously: it has to be specific enough, and it has to live long enough. Conversely, if you want to ensure you're never wrong, there are only two ways to do it. You either keep your statements vague, or you cycle through your viewpoints fast enough that none of them ever survives until validation day.
These two approaches share a common trait: they have nothing to do with your skill level. They work just as well for experts as they do for frauds.
Therefore, as long as the people handing out scores keep no record, vagueness becomes the strictly dominant strategy. Note that I said strictly dominant, meaning even experts will choose it. This is because clarity has a cost and errors carry a penalty, while being clear brings zero extra reward.
As a result, everyone starts sounding the same. Scores end up distributed purely by exposure frequency, volume, and responsiveness. Truly capable people realize their talent is completely unpriced here and simply leave. The ones who stay end up looking more and more alike until the system becomes a closed loop where no one speaks like a normal human being, nobody keeps records, and nobody even has anything left to record.
Breaking this cycle only takes one action: add a column to every statement.
1. If this statement turns out to be wrong, what would the world look like?
2. Anyone who can't fill that in gets zero points.
How low is the cost of doing this? It's so low that the only reason not to do it is that you actually don't want to know the answer.
The derivation and diagram are below.
My Kimi usage limits are almost out for the week, so I'll have to wait a couple of days before I can get back to work. Of course, I still have other options like GLM and DeepSeek. Some friends were asking me recently which one is better overall, and I think it really depends on the task. For some tasks, GLM and Kimi are both great.
However, last night I ran into a task where GLM burned through a ton of tokens without getting it done, and I finally had to use DeepSeek to finish it. GPT-5.6 or Claude Opus 5.0 could probably handle it pretty quickly, but those models are relatively expensive.
My usual workflow is to brainstorm with Claude or GPT, mostly using Claude Opus 5 for the brainstorming phase. Once that's done, I write out a detailed implementation plan and then have domestic models execute it according to the plan. That way, the token costs stay a bit lower.
The recent working paper from Brookings comes to some pretty alarming conclusions. With the US natural rate of interest up a full percentage point and fiscal policy, AI, and monetary policy all seemingly failing to explain it, the whole thing is billed as a mystery.
My takeaway after reading it is that the mystery probably lies in the methodology.
1. On the fiscal side, the event windows account for only about 10 percent of trading days in the full sample yet capture 20 percent of the increase, making the contribution per unit of time double the baseline. That is actually evidence supporting the fiscal channel, but the authors wrote it off as a negligible one-fifth. To claim the effect isn't significant, you first need to compare it against a null distribution generated by random sampling, which the paper doesn't do. The t-statistics sitting between 0.8 and 1.5 indicate that the sample is too short and statistical power is insufficient, not that the true effect is zero.
2. The AI group is even more absurd. GPT was released on March 14, 2023, and its three-day window happens to overlap with the safe-haven rally following the Silicon Valley Bank collapse. Treasuries were driven up by panic during those days, which had nothing to do with large language models. The authors claim the return distribution is fairly uniform, yet they failed to provide a single event-by-event breakdown.
3. Most fundamentally, the natural rate of interest is a slow-moving variable in general equilibrium. Global capital flows, deglobalization, and term premia are forces that simply do not choose to concentrate their release on specific announcement dates. Using an event study to capture a continuously drifting phenomenon and failing to find anything is almost guaranteed by the design itself, not a genuine discovery.
Perhaps the only claim this paper actually supports is a single sentence: the rise in the natural rate of interest is not concentrated within the three-day windows of these three types of announcements. As for the conclusion that it remains an unsolved mystery, I think an unverified tool does not mean an absence of evidence. The conclusion reads much more like a sensational news headline.
@Reuters Looking at just volume or just price on its own is wrong. Sure, there is the issue with the Strait of Hormuz, but oil prices went up, and profits increased. It is simply the net result of all those factors combined.
First, let's look at how these numbers are manufactured. Goldman Sachs uses the residual method: since Britain does not produce deliverable gold bars locally, imported gold either stays in London vaults or gets exported. They attribute the gap between vault outflows and customs exports entirely to sovereign buying.
However, this identification relationship broke down in August 2025: vault outflows continued, but customs exports no longer matched them. This is precisely why Goldman Sachs revised its 12-month moving average of central bank purchases up from 29 tons a month to 50 tons.
Furthermore, according to international statistical conventions, monetary gold is actually recommended to be excluded from trade statistics. A simple reclassification of data can manufacture the exact same signal while actual behavior remains completely unchanged. The 604-ton bar in 2015 was the exact same story: disclosure cadence is lumpy, not stealthy buying.
Even assuming the estimation is correct, it is not a prediction. The objective function of reserve management is currency structure and sanctions risk, not return maximization. Twenty-nines months of steady, moderate, price-insensitive buying is the signature of allocation rules. Someone who believes prices are going to double would buy as fast as possible to finish quickly and bear the market impact cost, rather than averaging in slowly over time.
Finally, 2,366 tons at current gold prices is roughly $130 billion, which accounts for less than 10 percent of over $3 trillion in reserves. Structurally, China remains long the dollar system. If the US runs into a genuine debt crisis, the portion that gold can hedge is very limited. The overall portfolio remains net-damaged and won't salvage much value.
Having worked at the PBOC for a few years, I can tell you that when it comes to forecasting future asset price trends, the PBOC is really no smarter than anyone. Of course, I left the PBOC a long time ago.
BREAKING: China acquired +40 tonnes of gold in June via the London OTC market, marking their 2nd-largest monthly purchase since early 2025.
This is 167% more than the official +15 tonnes reported by China's central bank for June.
This also follows an estimated +48 tonnes acquired through the OTC market in May, +380% above the +10 tonnes officially reported by the central bank.
Meanwhile, China’s central bank officially added another +20 tonnes of gold in July, its largest monthly purchase since October 2023.
Year-to-date, China has officially increased its gold reserves by +60 tonnes, bringing total holdings to a record 2,366 tonnes.
Therefore, China acquired an estimated +88 tonnes of gold through the OTC market in just May and June, more than the amount officially reported for the entire year so far.
China is buying far more gold than their official data shows.
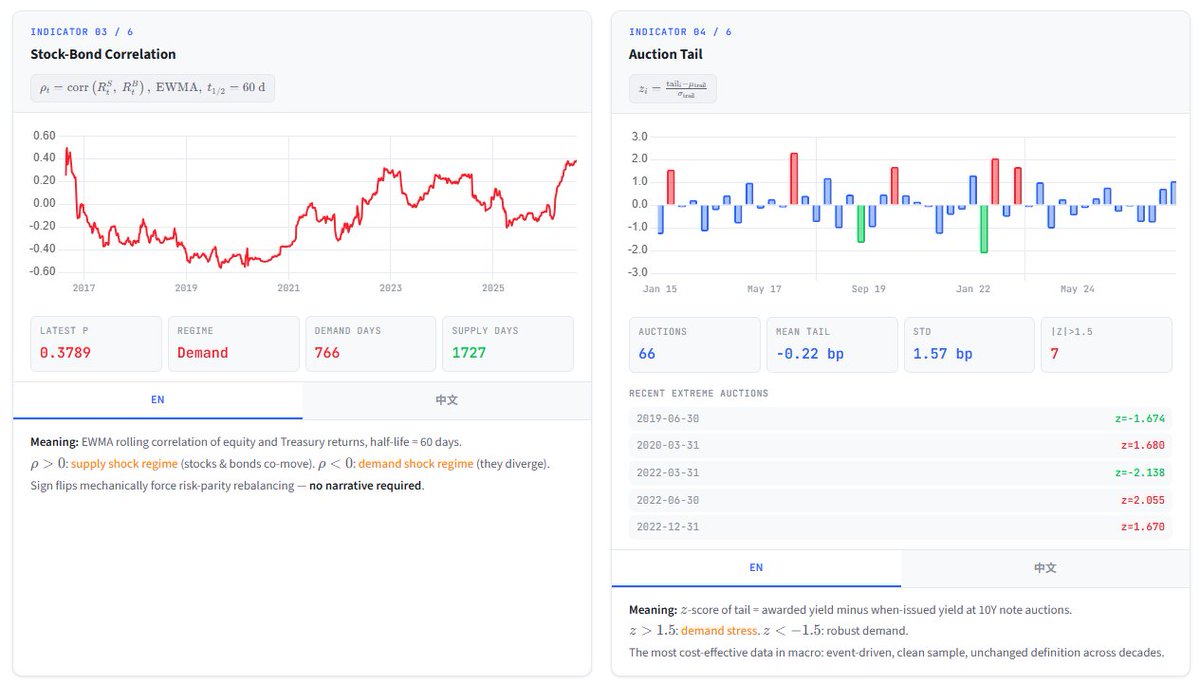
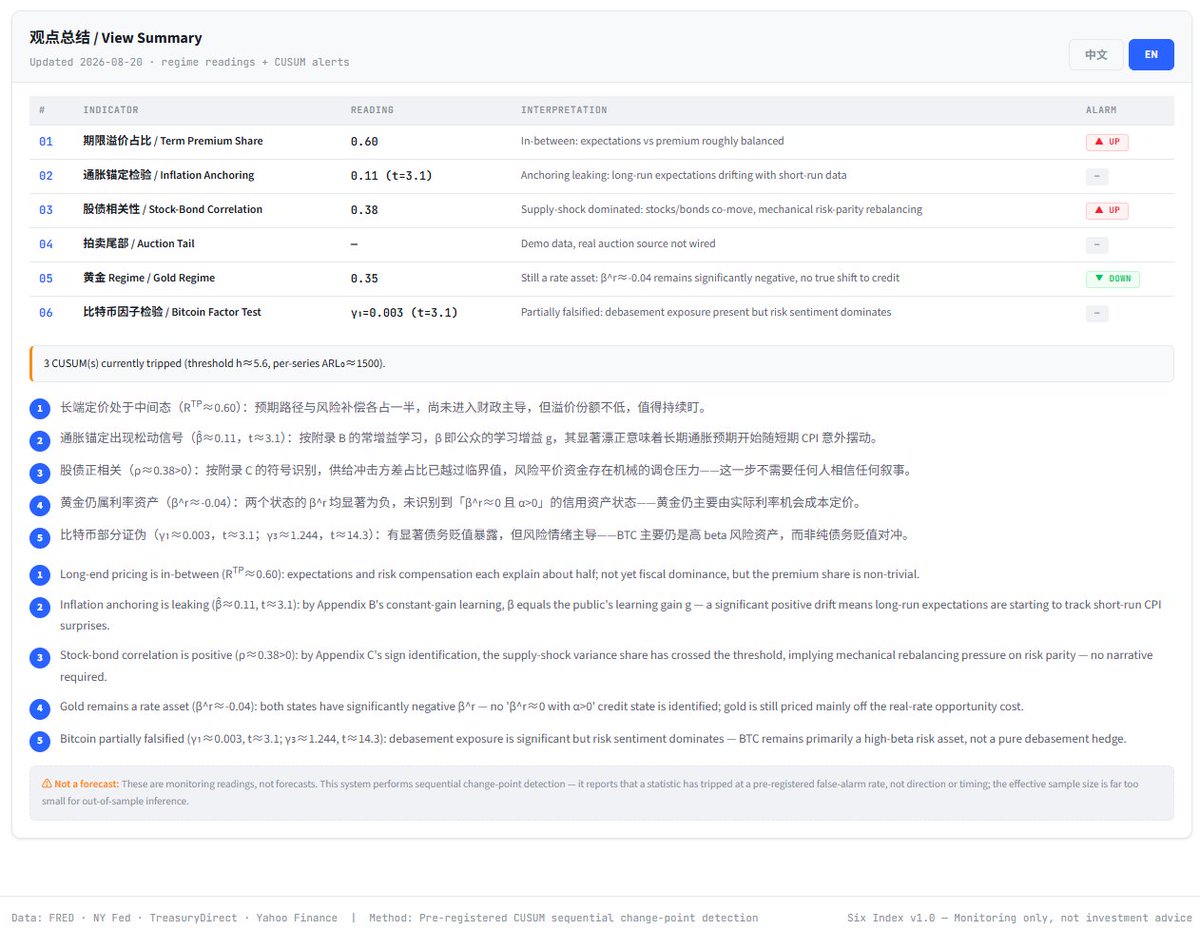
I had some time tonight to run the numbers for those six indicators we talked about. I ran and verified them a few times, so they should be solid, with one exception: recent data for the auction tail indicator wasn't available, so I filled in that gap with simulated data. The rest of them should be accurate, so feel free to take a look.
A quick disclaimer: these are tracking indicators, not predictive ones, but we can use them to gauge the current state of the market. Here is a breakdown of the six metrics:
1. Term premium and spread allocation: The term spread is currently sitting in a neutral state, with the expected path and risk compensation splitting things roughly 50-50, though risk compensation is slightly higher. This means we haven't entered a fiscal dominance regime yet. The premium share is actually a bit higher and warrants ongoing monitoring.
2. Inflation anchoring: Inflation anchoring appears to be coming loose. You can clearly see long-term expectations starting to swing around based on short-term CPI surprises.
3. Equities and bonds: Stocks and bonds show a clear positive correlation. The variance share from supply shocks has crossed the critical threshold, and risk-parity funds are facing mechanical rebalancing pressure.
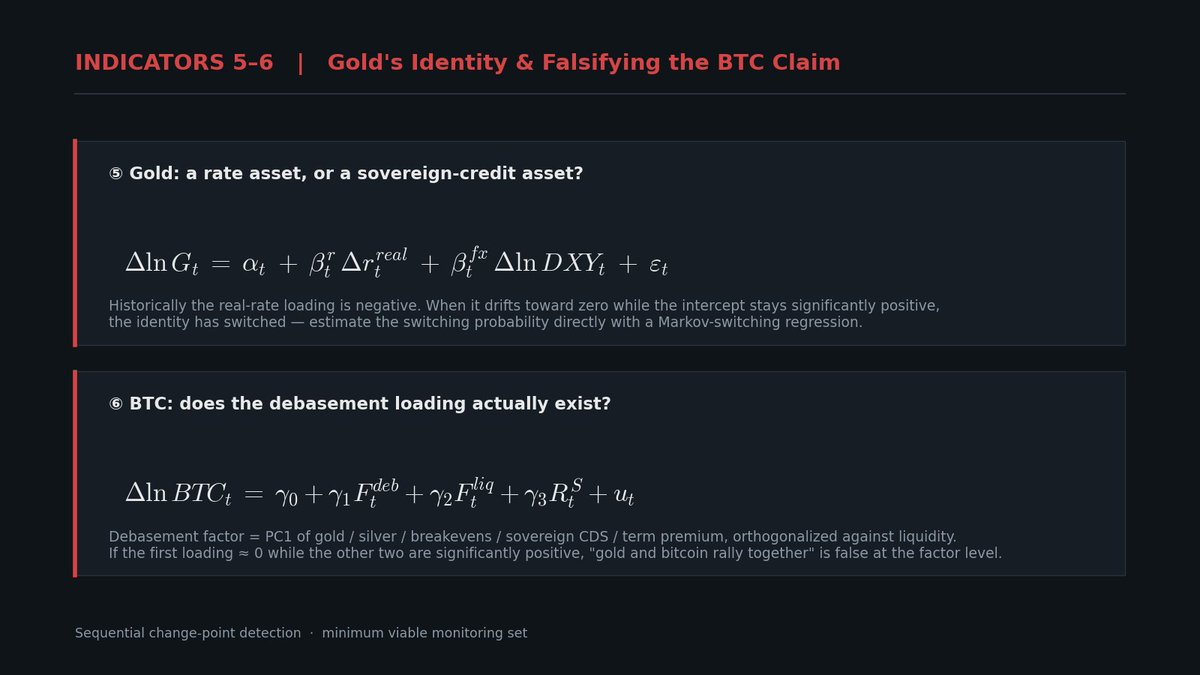
4. Gold: This might run counter to common intuition, but gold is still fundamentally a rate asset, priced on the opportunity cost of real rates. While many people see gold rallying lately and view it as a credit asset used to hedge against debt stress, its underlying pricing remains tied to real yields.
5. Bitcoin: Bitcoin has significant exposure to debt-debasement factors. While people's gut reaction is that it's driven by risk sentiment—and it is a high-beta risk asset—it's not a pure hedge against debt debasement.
Instead of trying to predict direction, it is better to track narrative regime shifts. US Treasuries, gold, and the US dollar are all currently explained by the same narrative: debt monetization. But narratives cannot be falsified. What everyone really wants to know is whether market mechanics are actually shifting, and if so, how quickly that can be detected within a few days, along with a tolerable false-positive rate for the monitoring indicators.
Here is a minimal viable monitoring set you can use:
1. Term premium share: Split the long-term yield into expected short-term path and term premium, then see how much variance the latter contributes. A ratio close to one means long-term pricing power has left the hands of monetary policy. Fiscal dominance is not just an adjective; it produces hard readings.
2. Inflation anchoring test: The mathematical meaning of anchoring is straightforward: forward inflation expectations should not react to short-term inflation data. Run a rolling regression of break-even inflation changes against CPI surprises; if the slope turns significantly positive, that is the first evidence of eroding credibility.
3. Stock-bond correlation: This has the highest information content of any single indicator. A sign flip is the defining feature of the transition from an inflation regime to a fiscal regime, and it directly dictates the forced repositioning of risk-parity capital. This mechanism is purely mechanical and requires no belief system.
4. Auction tail: Standardize the difference between the stop-out rate and the when-issued rate. This gives a direct reading of marginal buyer demands. When the Treasury tries to lean on the long end and fails, this is where it shows up first, rather than on the yield curve.
5. What asset class is gold, really? Historically, gold has had a negative loading on real interest rates, making it a rate asset. But if that loading approaches zero while the regression intercept remains persistently and significantly positive, it means gold's pricing logic has shifted from rate trading to sovereign credit trading. This can be estimated using Markov switching to get transition probabilities instead of relying on gut feeling.
6. The positioning of digital assets: Ray Dalio has been encouraging people to look at gold and digital assets, but you can first construct a debt-devaluation factor, orthogonalize it against a liquidity factor, and then check digital assets' loadings on both. If the debt-devaluation loading is near zero while liquidity and equity betas are significantly positive, the claim that gold and Bitcoin will rise together is wrong at the factor level—it forcefully combines two currently opposing views.
Of course, this is simply an alert mechanism. Each indicator is standardized, and when the cumulative score exceeds a threshold, an alarm triggers. You can derive the threshold using average run length under the null hypothesis.
Finally, a couple of potentially unpopular facts: since 1970, independent macroeconomic regime-transition events total only about eight to twelve, giving an effective sample size of fewer than fifteen. That means none of these models have out-of-sample predictive power; they can only serve as tracking indicators. If anyone tells you their macro model has regime-prediction capabilities, they are either deceiving themselves or trying to hoodwink you.
The sole value of this monitoring framework is that it translates "I feel like a regime change is coming" into an alarm based on a specific statistical measure and a preset false-positive rate. The former is unfalsifiable, but the latter is.
Maybe before it starts hallucinating, the engineering cuts off its long tasks, and then there's this continuous loop of feedback and course-correction afterward. So I feel like the impact of hallucinations is a bit smaller now, but it comes with massive token consumption and the generation of a lot of redundant code.