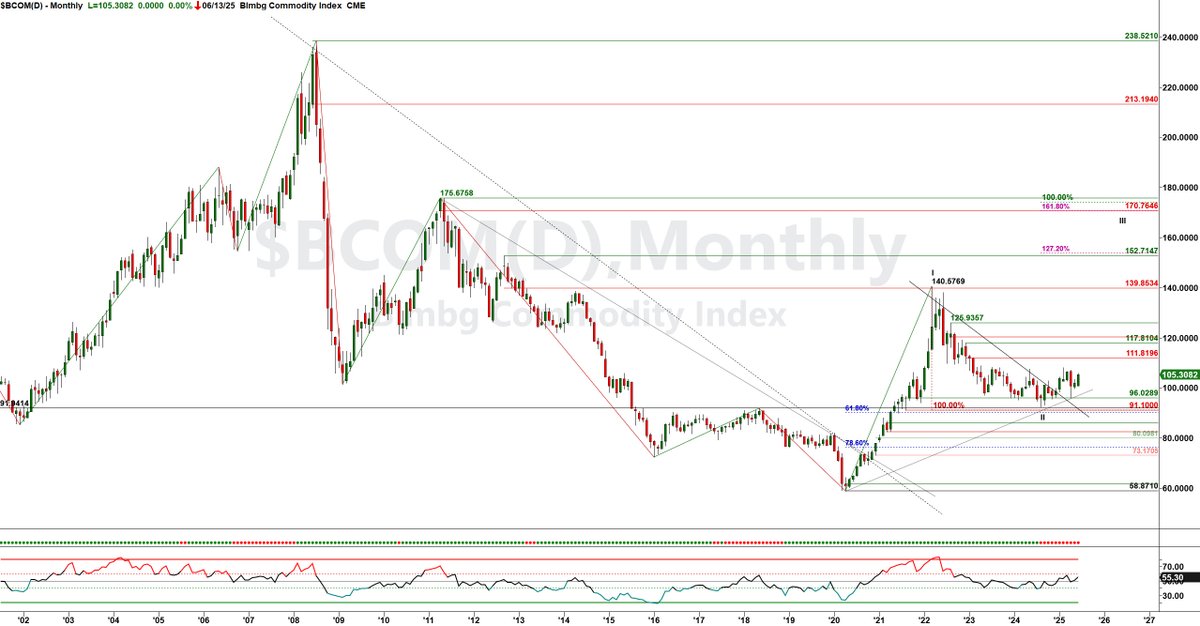
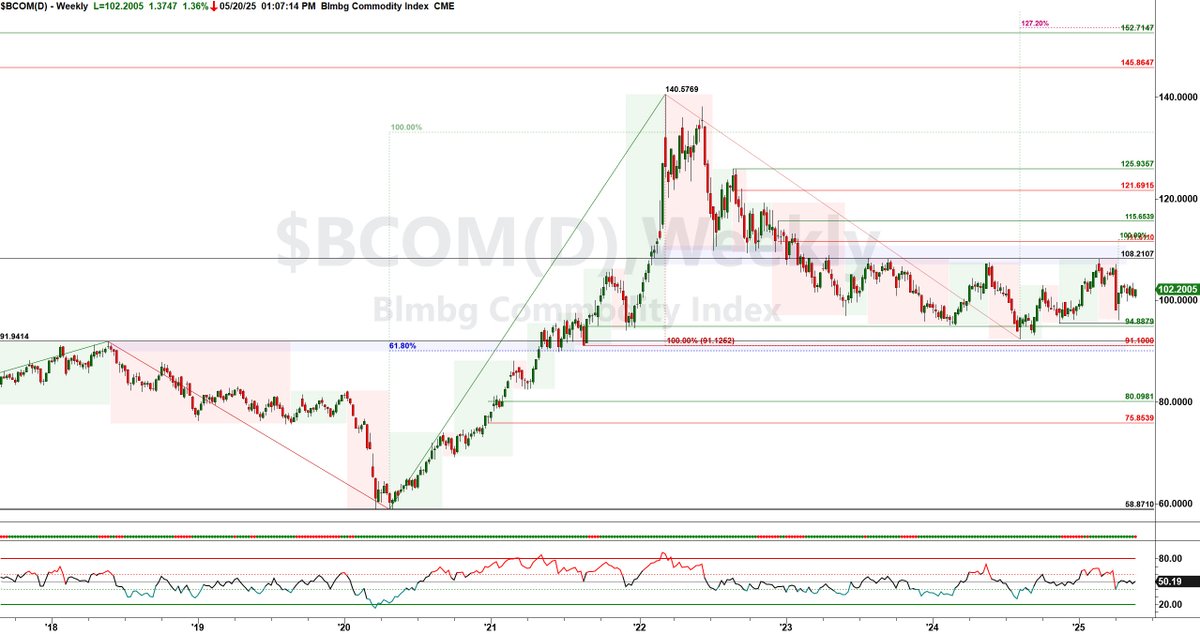
#Commodities continue to act well. $BCOM, having already formed a weekly higher low, is poised to threaten its anchor high @ 108.2107. A close above said level would confirm a higher weekly high and terminate the downtrend est. 3/2022 - a materially bullish signal for hard assets.
Momentum oscillators are constructive. The daily #RSI value line has cleared 65, while weekly/monthly RSI readings are hovering just below 60, hooking higher. The #MACD (not pictured) is also on the verge of generating multi-timeframe bullish crossover signals, further threatening #commodity bears.
#BCOM remains in nested monthly/weekly Bollinger Band-Keltner Channel 'squeezes,' with upside momentum building. Daily volatility has already expanded, breaking out to the upside on 6/9 - a potential harbinger for higher timeframes. Should commodities retrace in the short-run, look for BCOM to seek support 103.5304-101.5535 before attempting an impulse higher.
$DBC #DBC #commoditymarkets #energy #metals #agriculture #livestock #technicalanalysis
The technical picture for #commodities is relatively unchanged vs. prior posts but still skews constructive. It's possible that we saw a supportive retest of the weekly downtrend line (drawn from 1H22 high), which $BCOM closed above in early January. However, a definitive bullish signal has yet to materialize, with price action continuing to base.
My long-term opinion on hard assets remains intact, as does my conviction in their value as a strategic portfolio diversifier. Technically speaking, I believe #BCOM may be in a wave-2 corrective phase, with a bullish wave-3 to follow - one that will see prints above Q122 highs. This outlook holds even in the event of a selloff/trading below 2024 lows, which I would regard as an attractive buying opportunity.
$DBC #DBC #commoditymarkets #energy #metals #agriculture #livestock #technicalanalysis #oncallforvol
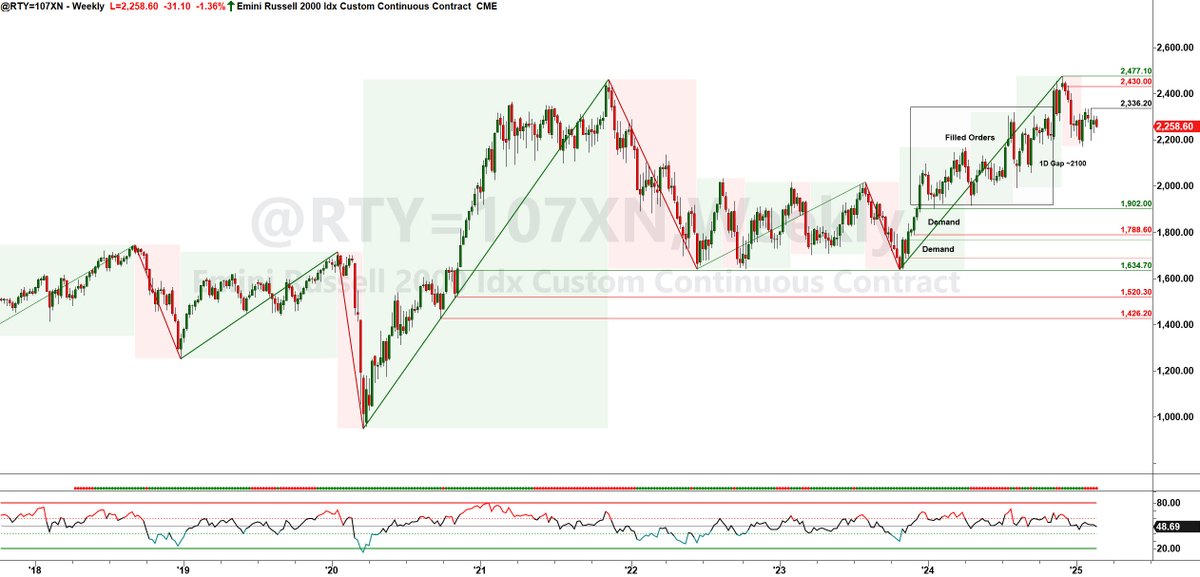
Despite the appearance of $SPX and $NDX, I’ve been concerned about the weak RSI prints across monthly/weekly/daily timeframes for US equity indices + comparatively depressed VIX. $VVIX (volatility of volatility) has been climbing for a several trading sessions and there was evidence of hedging today given the $VIX pop. $RTY_F and $YM_F traded into cleaner supply vs. the S&P and NASDAQ - further indications of potential downside risk. Besides the 5756.50 anchor low, there’s not a lot to stop $ES_F from falling to the gap @ 5700.
#oncallforvol
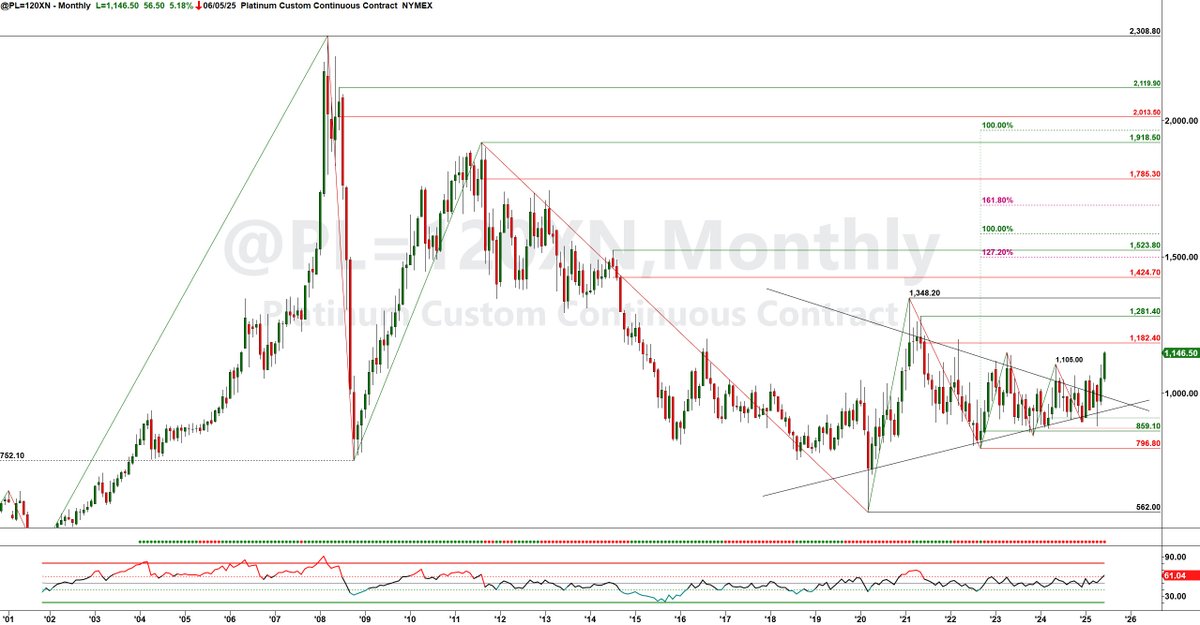
Historic divergence between #gold and #platinum persists. $PL, which has massively lagged $GC, is in a long-term compression pattern. If there's ever an expansionary catalyst, the ensuing move could be sizeable.
$XAUUSD $GC_F $GLD $XPTUSD $PL_F $PPLT #commodities#metals #trading #futurestrading
As anticipated, #platnium is a big mover today, confirming the topside breakout from its multi-year falling wedge/symmetrical triangle pattern. Barring substantial rejection, $PL_F has formed fresh weekly demand 1091.30-1041.90, which should insulate existing longs/present an attractive buying opportunity if prices correct to said zone following the termination of the current bullish impulse.
Price action never lies - the shift in last week's managed money short-long positioning reinforced the $XPTUSD bull thesis. MM short interest declined by ~10%, while MM longs jumped 31%, marking a significant shift in market participant sentiment.
$XPT #XPT #XPTUSD #preciousmetals #metals #technicalanalysis #oncallforvol
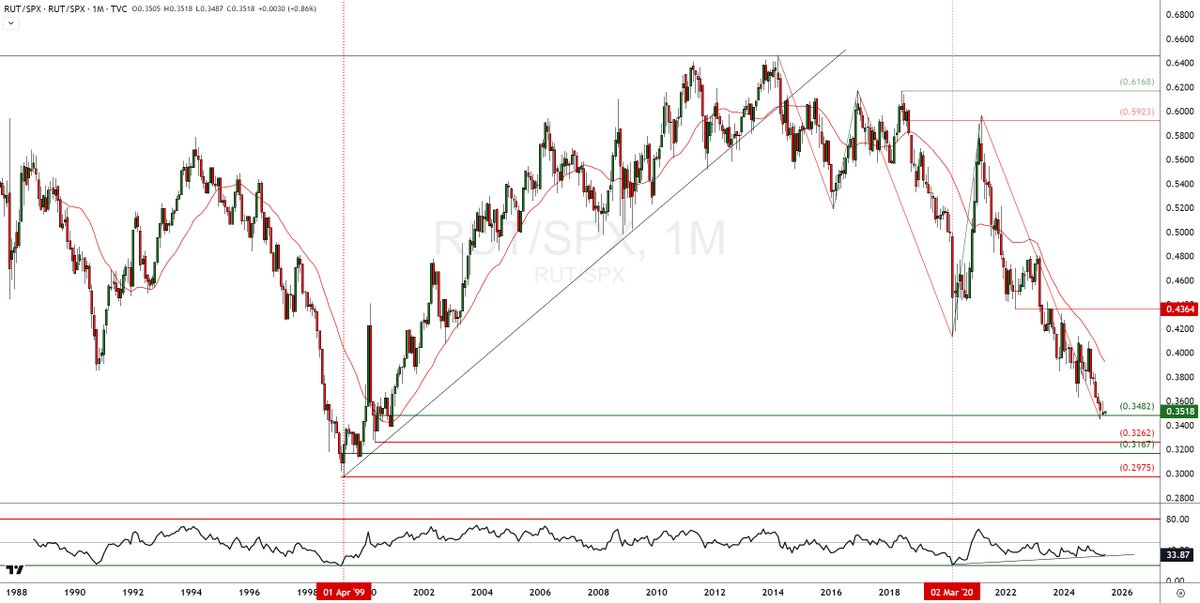
Despite sustained upward pressure on domestic rates, lingering trade/inflation concerns, and "wait-and-see" Fed policy, small-caps look constructive (as do other US equity indexes). The Russell 2000 remains near historic relative strength lows vs. US equities broadly. However, the RS ratio is into prints that previously preceded $RUT outperformance, and #RSI bullish divergences are observable.
0.3669 is the initial anchor high to watch. A close above - followed by a higher low and subsequent follow-through - could signal early-stage rotation into small-cap stocks. While it's premature to bet against continued large-cap and tech leadership (NDX/SPX is breaking out to all-time highs), small-caps may soon warrant consideration as a portfolio diversifier given the market's narrow breadth.
$RTY $RTY_F $IWM #RUT #RTY #RTY_F #IWM #Russell2000 #technicalanalysis #relativestrength
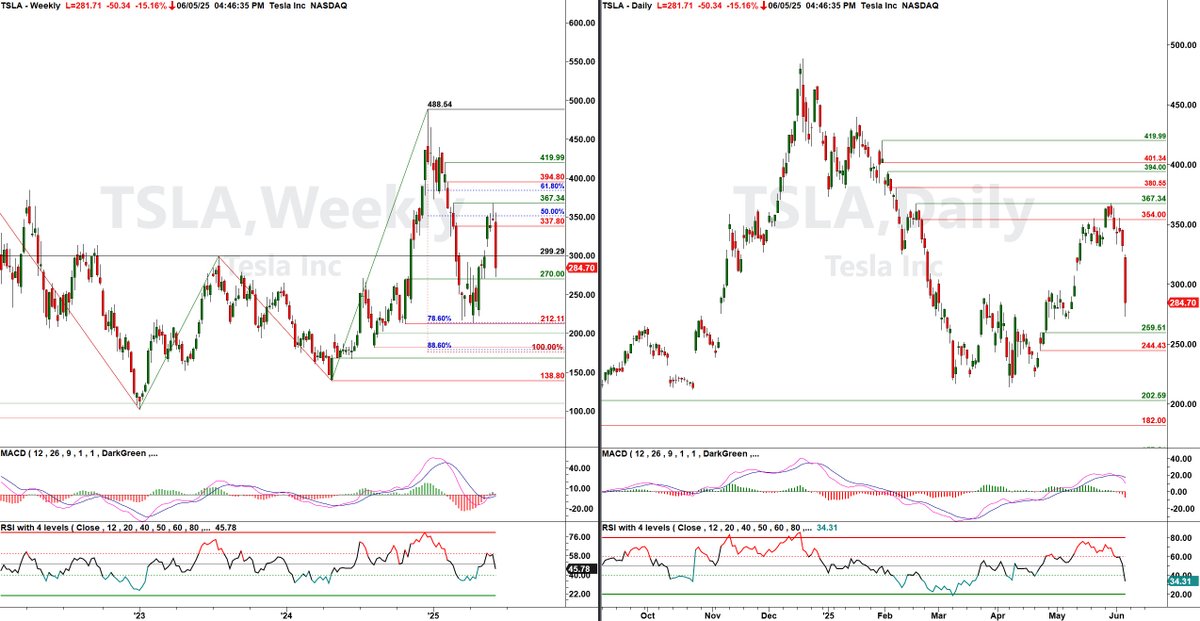
#Trump-#Musk headline or supply and demand? Rhetorical question - news is just a catalyst.
$TSLA traded into weekly supply, originally identified on 2/27. As price arrived at the SZ, the 1W #RSI was printing < 65 (barely pierced 60), indicating that supply was NOT a lie. On the daily TF, a bearish divergence materialized alongside a #MACD sell signal on 6/2.
I noted yesterday that the $VIX was comparatively depressed and that equity longs should be managed conservatively following a ~20% recovery from the 4/6 low + #NFP tomorrow...
Not rocket science, but definitely not luck. Price action remains undefeated.
#Tesla #TSLA #technicalanalysis #volatility #oncallforvol
$TSLA analysis. #Tesla's getting into daily demand, so keep an eye on it. Note that monthly/weekly buy zones are lower and US equity markets remain weak; definitely a time to wait for lower timeframe trend reversal signals/use confirmation entries. Weekly RSI also breaking below 40, which suggests add'l downside. Wouldn't be selling here though.
#trading #options #optionstrading #stockmarketcrash #lionharttrading
Hi-ho, Silver! Next meaningful supply @ 40.831-44.275, but projected targets suggest $SI_F $XAGUSD could be headed for ATHs. Massive upside breakout for #platinum (as called) with #copper moving as well - both metals have been in multi-timeframe Bollinger Band-Keltner Channel compressions, which often precede large directional moves when #volatility inevitably expands.
$PL_F $XPTUSD #XPTUSD $HG_F $XCUUSD #XCUUSD $SLV $SIL $SILJ #SLV #SIL #SILJ #XAGUSD #silver #preciousmetals #drcopper #technicalanalysis
14K increase WoW in unemployment claims. IJCs actual = 240K vs. 229K estimated. Structure of multi-year base is looking more and more primed for an upside break w/ momentum building. For the sake of the #economy, let's hope not...
#economics#macroeconomics#econ#recession
$VIX retesting daily demand formed 3/25-27. Prudent to exercise some caution with equity longs, especially given mixed momentum signals across M/W/D timeframes and $SPX 6000 major psych. #Treasuries bid, #USD offered following soft @ADP private payrolls and @ism PMI prints. Next up: weekly jobless claims (tomorrow) and #NFP (Friday). Hold onto your hats... #volatility #oncallforvol
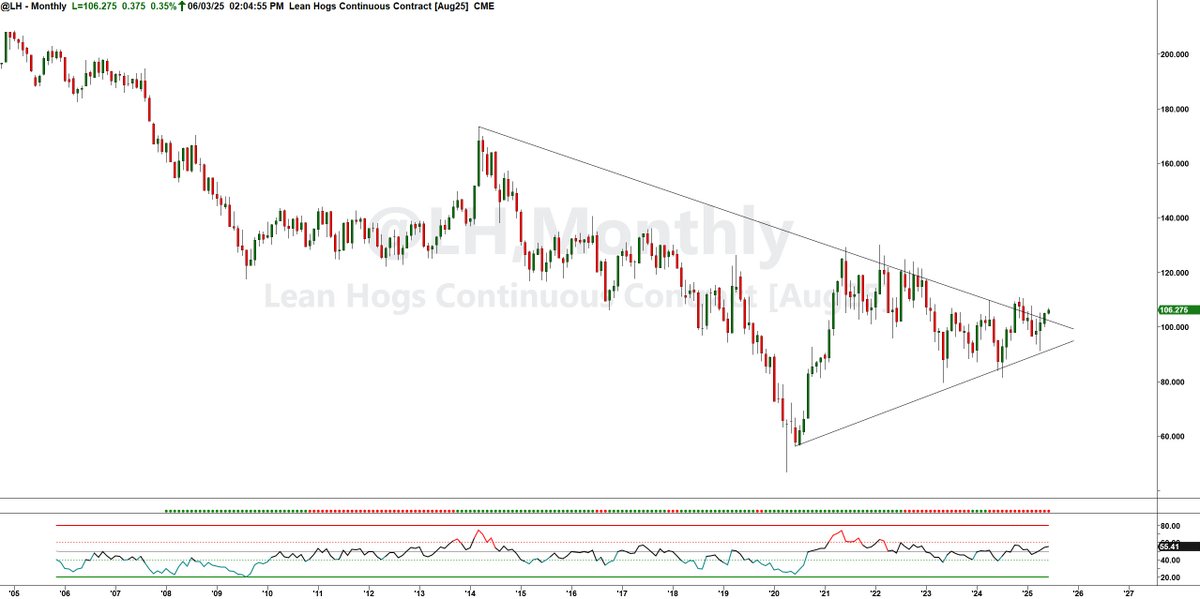
Significant disparity between the continuous and adjusted continuous (accounts for contract rollover-driven distortion) charts for $LH_F. Nonetheless, hogs appear poised for a topside breakout.
#leanhogs#livestock#technicalanalysis
#Uranium $URA trade has worked well, now testing ATHs with a momentum tailwind. If the near-term uptrend stalls, watch for a correction to the 5/22-23 downside gap (28.52-27.79), which formed following @POTUS’s #nuclearenergy EOs. There is additional continuation demand < 26, which could present an [even more] attractive buying opportunity, assuming oscillators are supportive.
#URA $URNM #URNM $NLR #NLR $SRUUF #SRUUF #nuclear #energy #technicalanalysis
$EFA vs. $SPY ratio is worth keeping an eye on. No clear signal yet, but a hold of 0.1453 followed by a push higher, above 0.1570, would signify an intraweek trend reversal and continued investor preference for international stocks vs. US. 0.1794, the weekly anchor high, controls the longer-term downtrend. All HTF trend shifts start as LTF trend shifts though...
#technicalanalysis #relativestrength #globalmacro #oncallforvol